
Embeddings can be hard to intuitively understand. To build instinct of how AI embeddings absorb knowledge of the Earth, we have created an interactive visualization of the relationships between hundreds of thousands of satellite imagery embeddings across the entire planet at https://embeddings.earthindex.ai/.

Embeddings are numerical representations generated by AI models. Earth AI models capture spectral characteristics, geometry, texture, and spatial relationships. Instead of storing information as explicit categories, the model converts satellite imagery into numerical vectors that ultimately represent patterns such as vegetation, land cover, and facilities.
For Earth Index, we produce 384-dimensional vectors from Sentinel-2 imagery for locations across the planet. While those dimensions are not directly human understandable, together they allow the model to uncover patterns across the landscape and power Quick Search (or similarity search) and Deep Search (classification model training) in Earth Index.
To mark the launch of Earth Index Open Access, we wanted to scale up the Alabama visualization we built years ago to cover the entire world, and explore what embeddings “look like”.
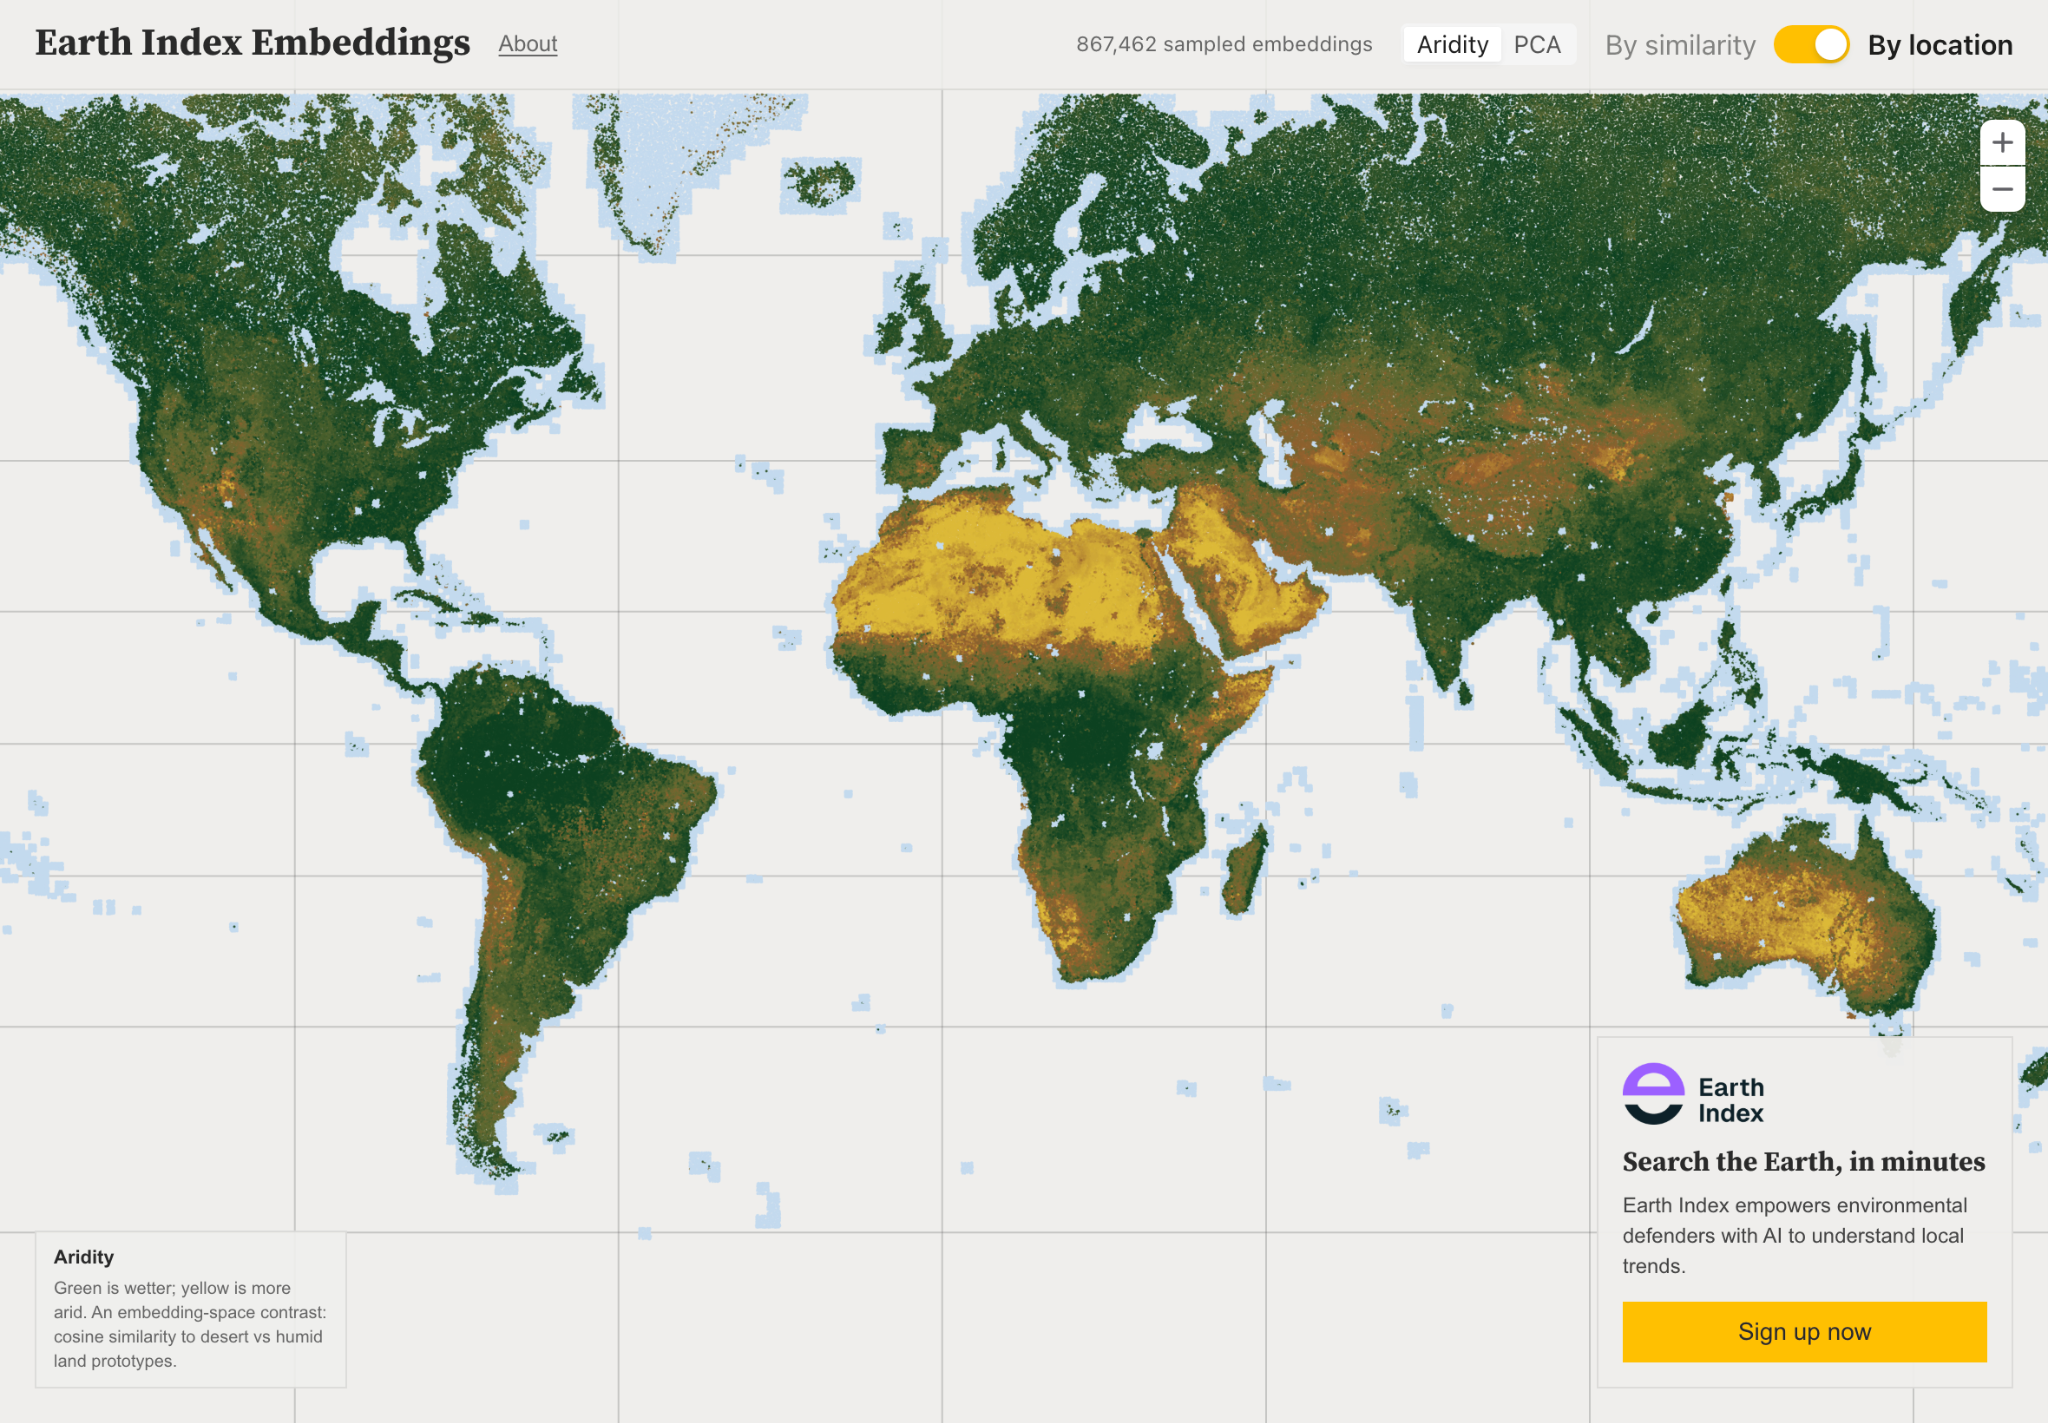
At first, the visualization looks like a normal map of Earth. Forests remain in the Amazon, deserts stay in the Sahara, and agricultural regions appear where you would expect them geographically. But in similarity mode, the map reorganizes itself based on relationships learned by the embedding model rather than physical location. Deserts in Africa begin clustering with deserts in Australia, while tropical forests from South America, Africa, and Southeast Asia drift toward one another.

To create the visualization, we sampled more than 800k embeddings from the billions in the Earth Index embeddings database. The database is geographically partitioned into tiles, allowing embeddings to be distributed efficiently across infrastructure and queried at planetary scale. To build the visualization pipeline, we created a one-to-one mapping between those database partitions and sampled Parquet files, making it possible to process and work with the data tile-by-tile rather than as a single global dataset. This also made the workflow resumable and scalable while preserving broad geographic coverage.
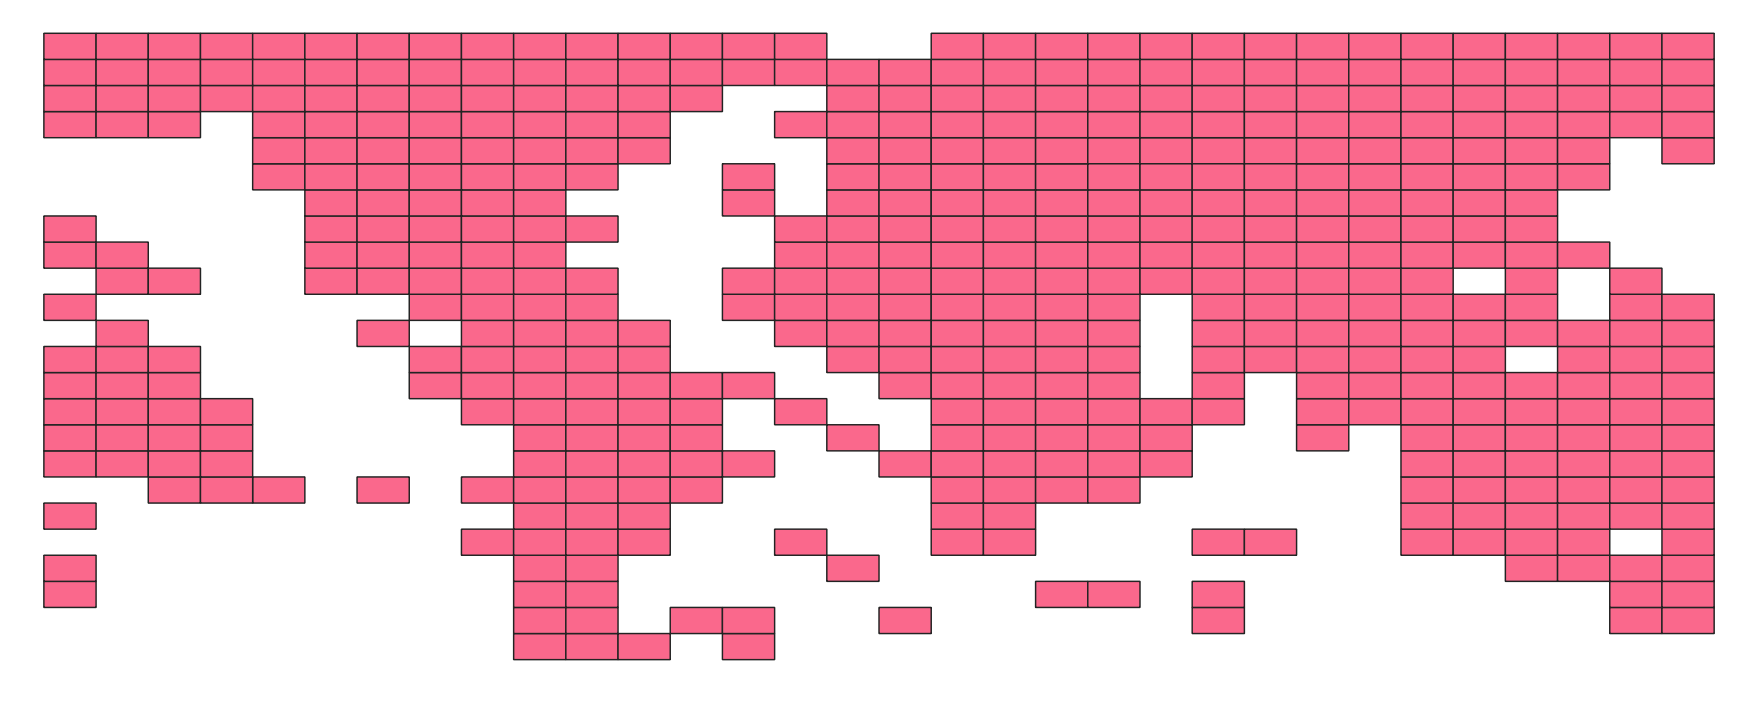
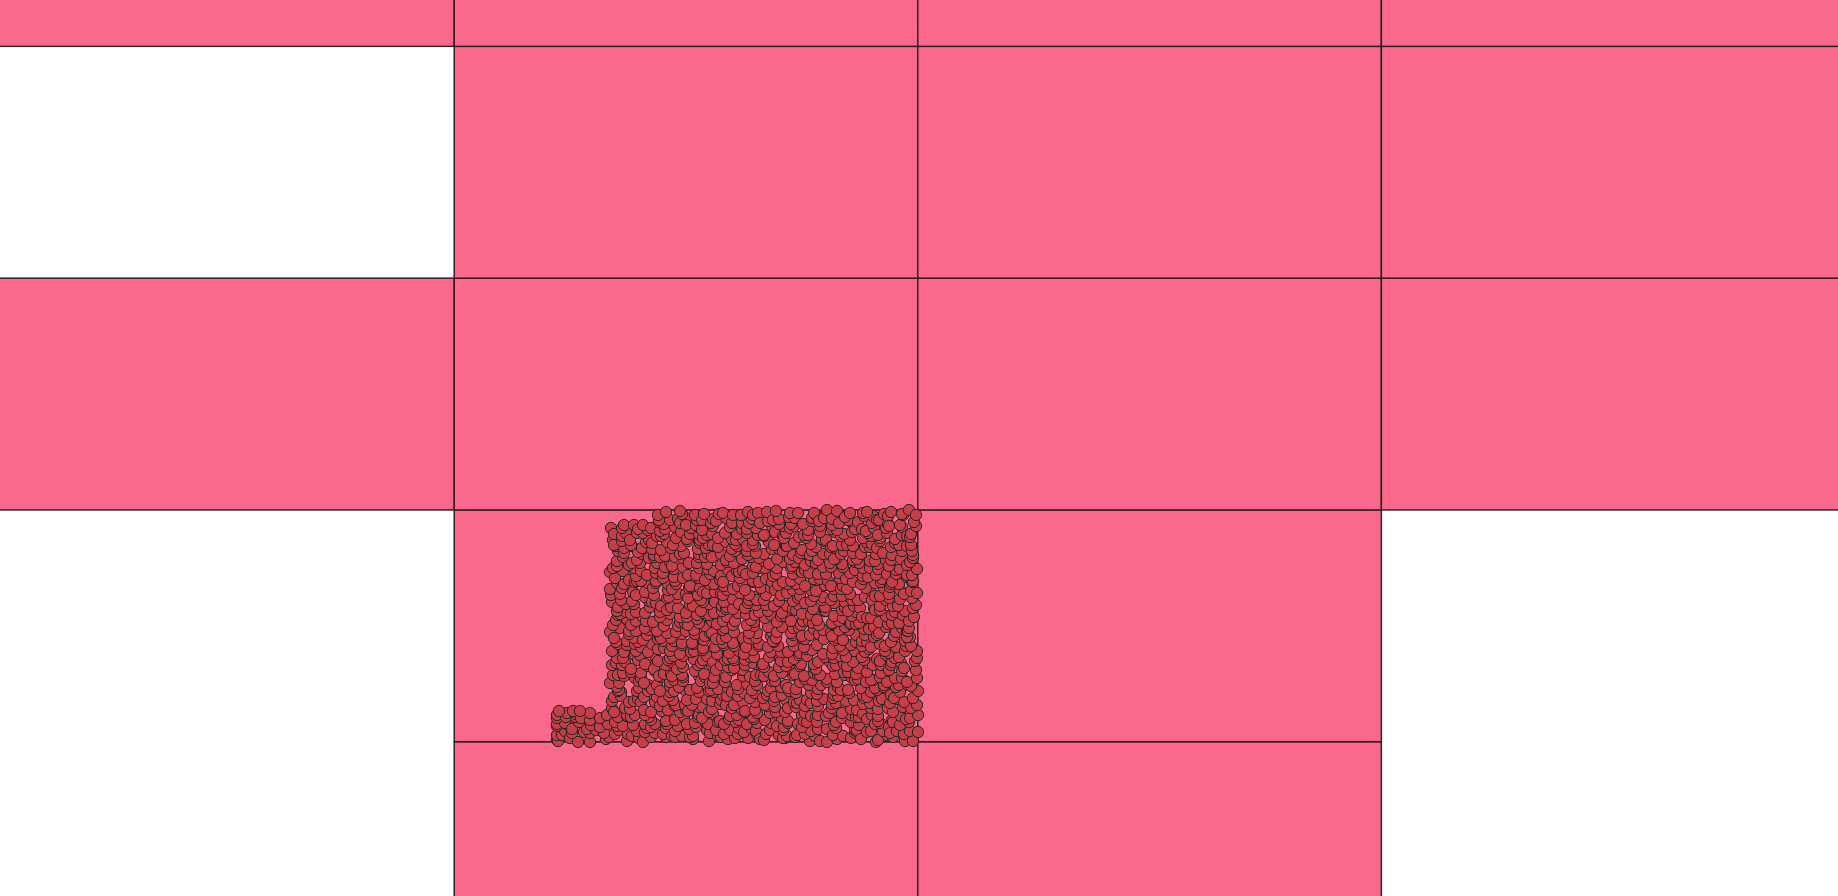
Rather than sampling points completely randomly, we used spatial sampling. Each partition was sampled evenly across grid cells so that deserts, forests, agricultural zones, wetlands, mountains, and remote landscapes would all remain visible in the final embedding space.
Because humans cannot visualize hundreds of dimensions directly, we used a dimensionality reduction technique called UMAP to project those relationships into two dimensions. UMAP preserves local similarity relationships between points, allowing landscapes that the model sees as related to cluster together visually.
We also generated an aridity score for each point in the visualization to help reveal large-scale environmental structure. The score was derived directly from the embeddings by comparing how closely landscapes resembled dry desert environments versus humid tropical environments. That score was then used for coloring the visualization, helping deserts, tropical systems, and transitional regions emerge more clearly in embedding space.
Build your understanding of embeddings, and then search the planet in Earth Index.
Other articles
.png)
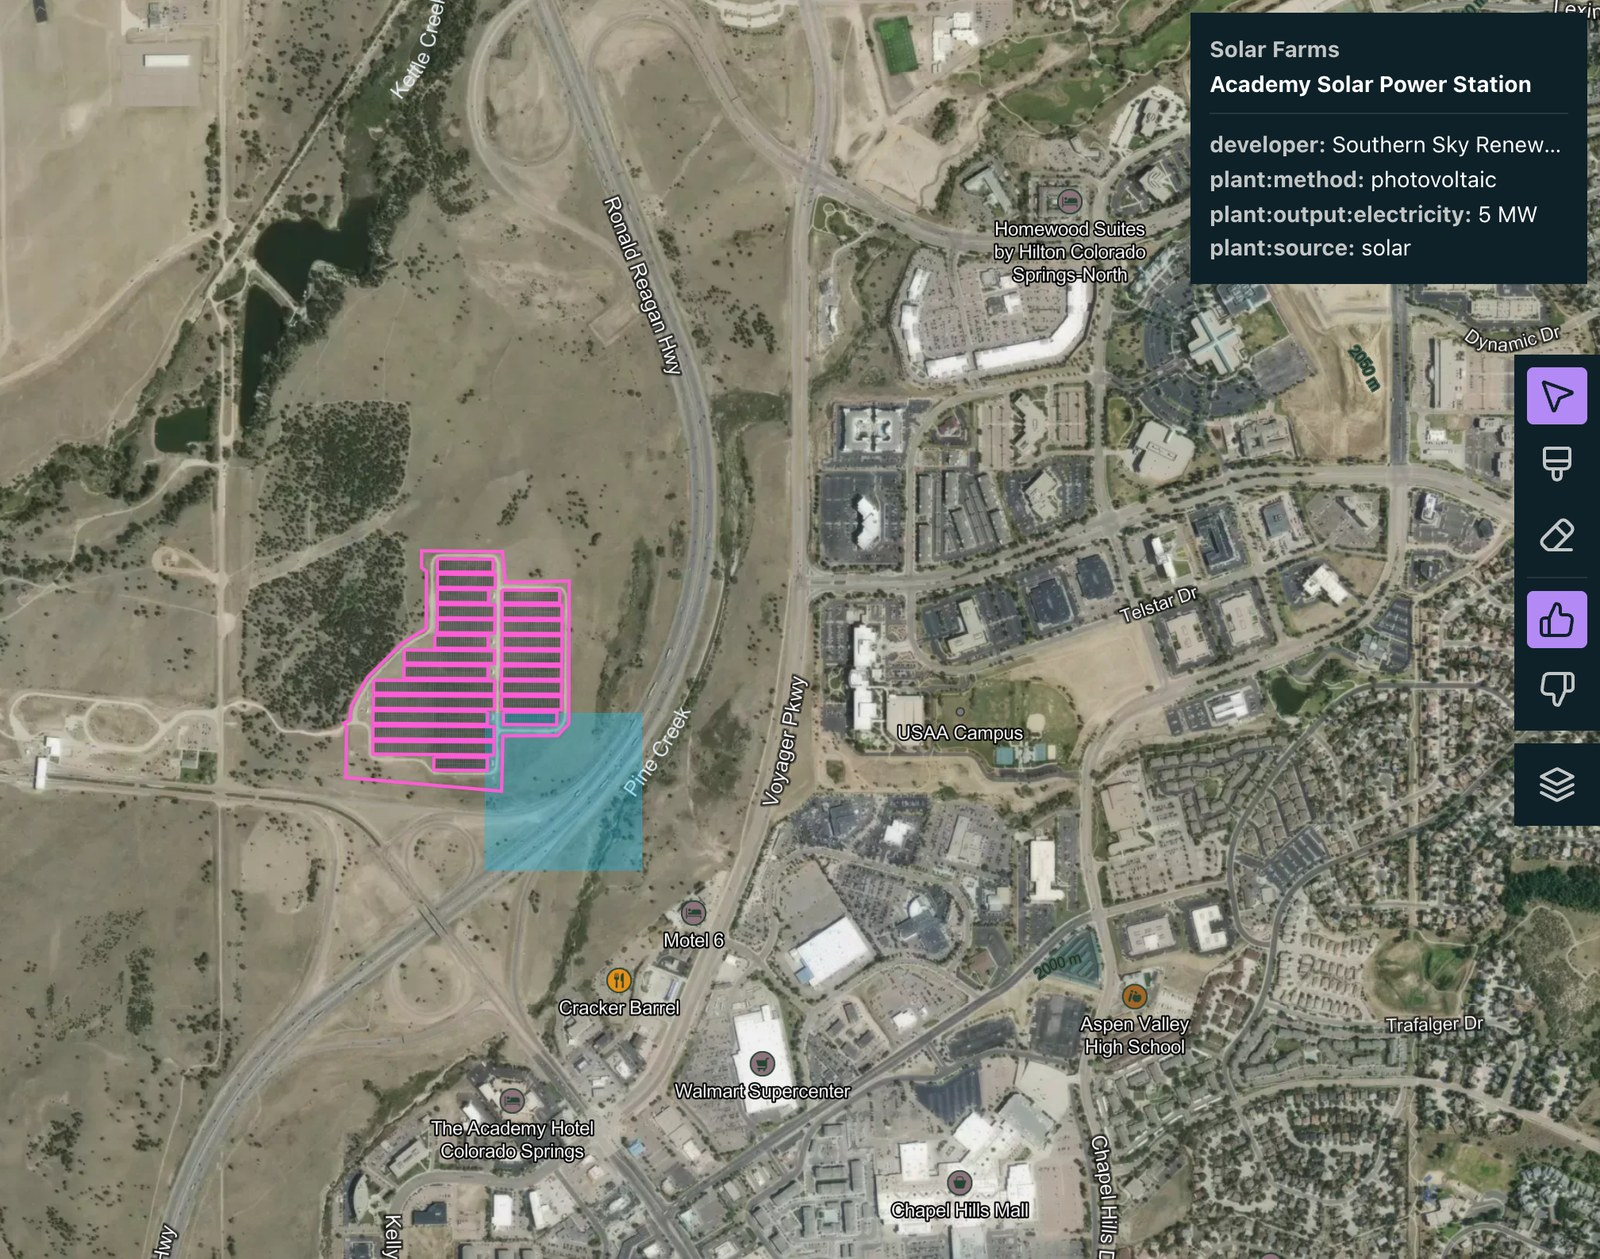
Search for Stuff: build a map layer by describing what you want to find
You can now create reference layers in Earth Index by describing what you want to find in plain language.

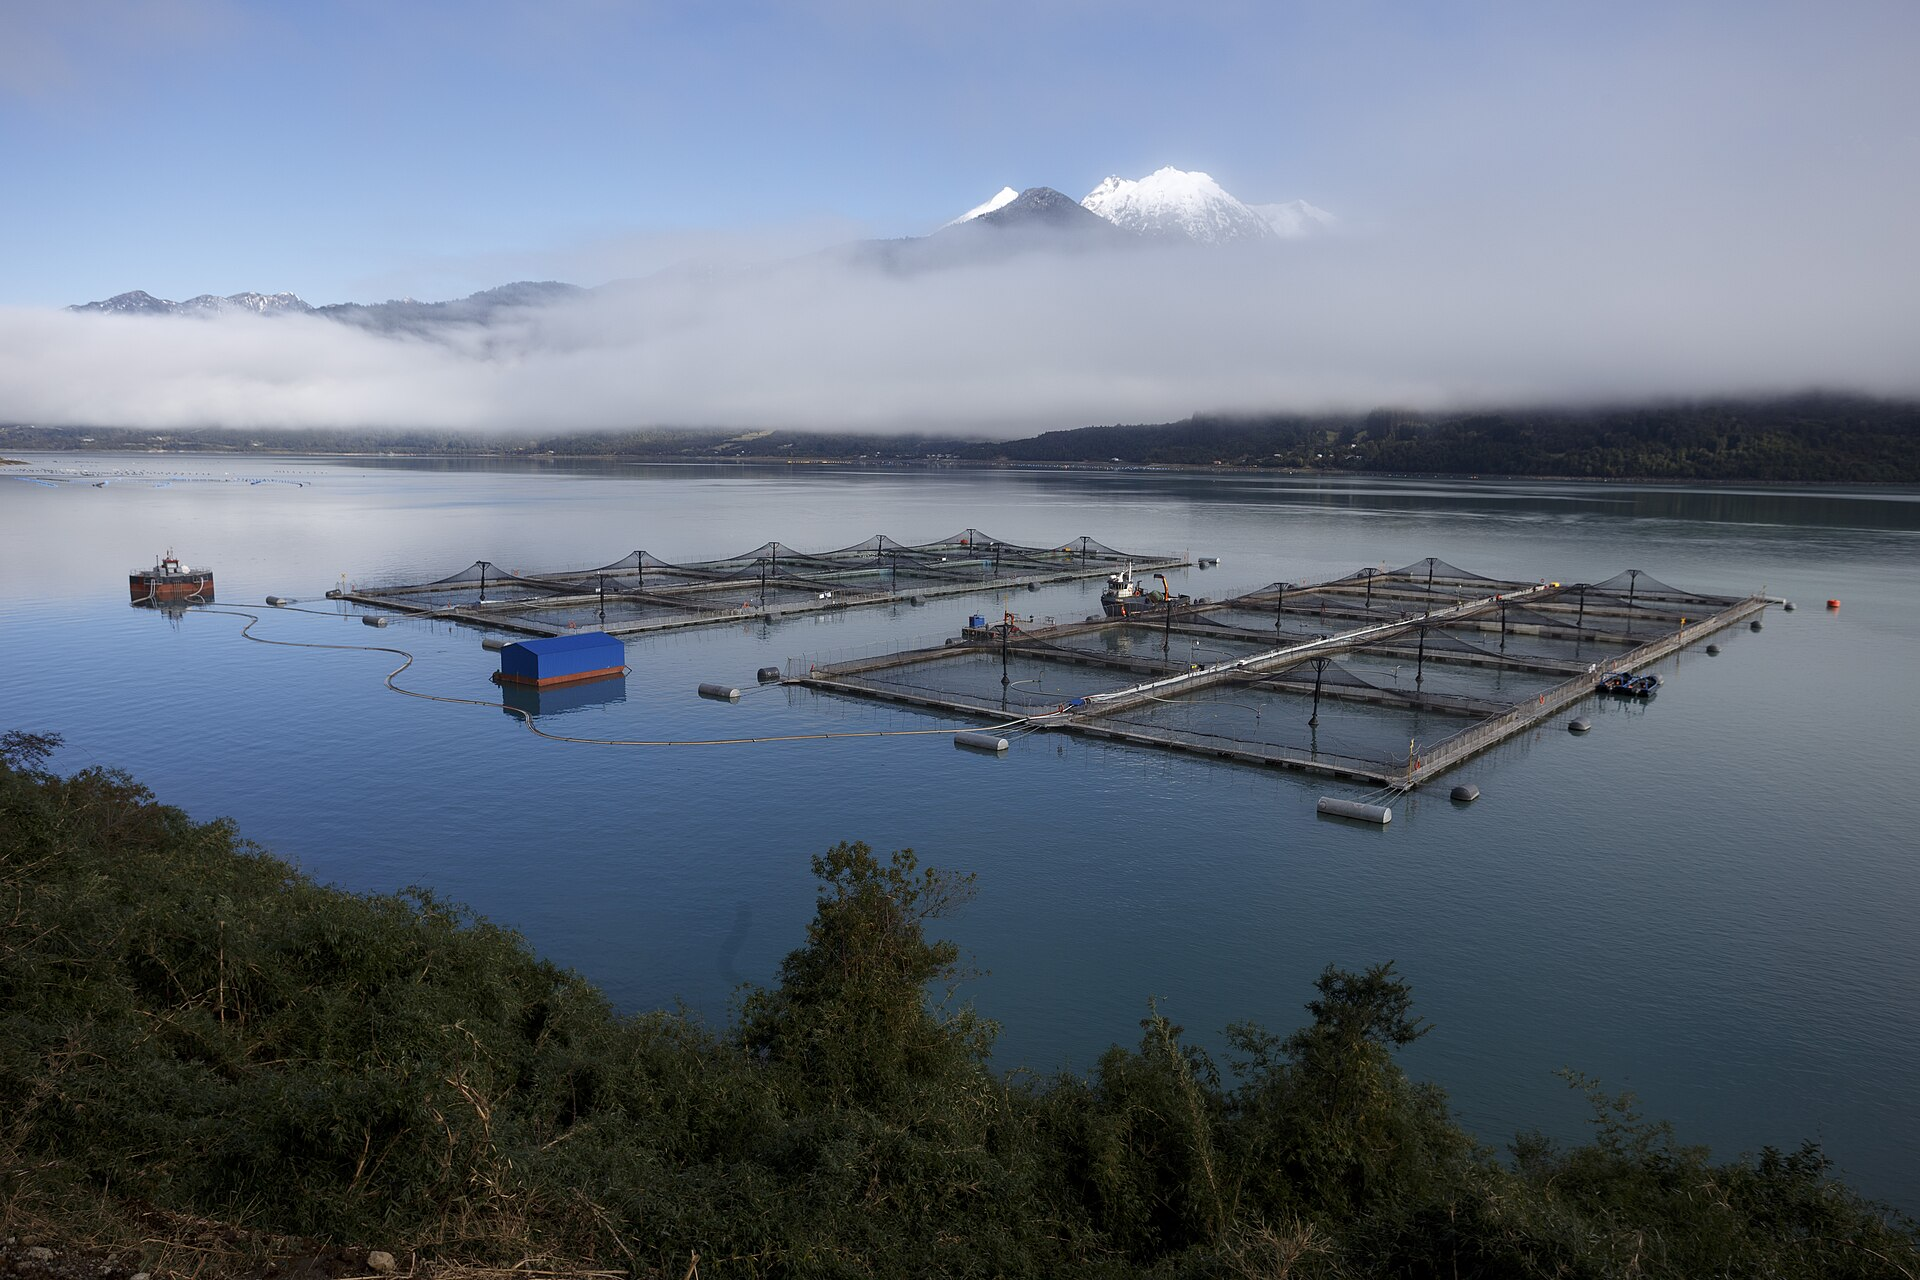
Using Earth Index as an independent validation tool for aquaculture regulations in Chile
Earth Index offers an independent satellite monitoring solution for global aquaculture, empowering regulators, researchers, and non-profits to ensure compliance and sustainable practices.


Two Foundation Models Are Better Than One
A Second-Stage Classifier on AlphaEarth Embeddings, and the Case for Domain-Specific FMs