
This week we are releasing new machine learning models and a new data series, in a full data replacement update for Amazon Mining Watch. For those working to stop illegal artisanal and small-scale gold mining, we hope this leads to quicker alerts and more robust data for analysis, and ultimately, to meaningful curtailment of wildcat mining. The new data covers mining activity through the second quarter of 2026.
Highlights of the release
A new machine-learned model to detect gold mining activity. The production detector is an ensemble of convolutional neural networks, trained from scratch on Sentinel-2 satellite image data. The detector makes a probabilistic assessment of the presence of mining on patches of imagery, each covering an area 480m x 480m on the ground. The new models achieve 99% specificity and 90% sensitivity at reasonable working thresholds. Details and nuances are discussed on our GitHub page.
New output data, 2018–present. Detections have been recomputed yearly, 2018-2024, and quarterly starting in 2025 until April-June 2026. We expect new data to post within 10 days of each quarter's close.
A fine-tuned SAM2 segmentation model delineates mining scars in the areas detected by the primary neural network. These mining scar masks significantly improve impacted area estimates over our previous NDVI-based method.
In 2025, we revamped the website to support viewing activity by political jurisdiction, protected area, or Indigenous territory. The mining scar masks inform area trends and a presumption of illegality estimate for each jurisdiction, as well as socio-economic cost estimates from partner Conservation Strategy Fund.
2026 at first glance
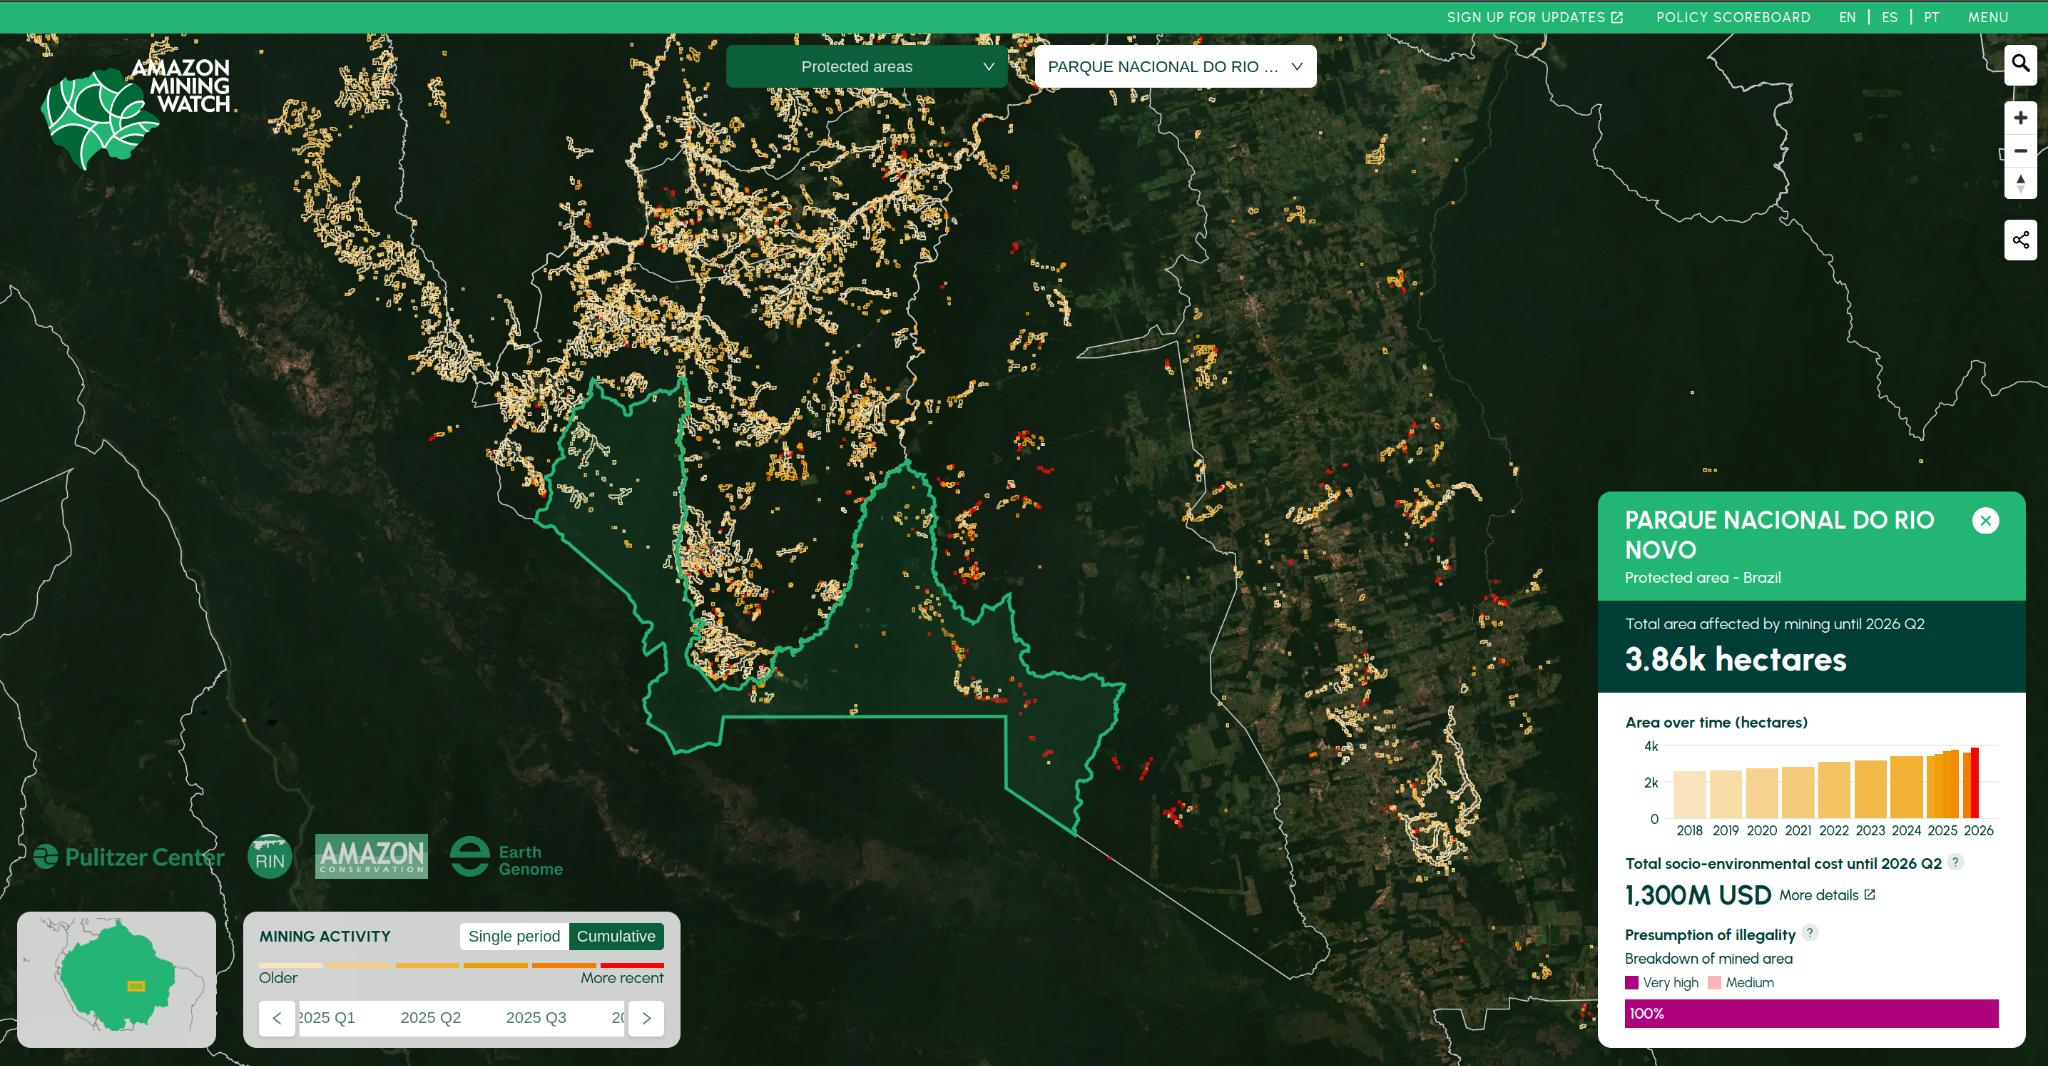
In our most recent data, the southern Tapajós basin in Brazil appears as a persistent front of mining expansion. The Tapajós valley has been one of the most mined territories in Brazil since the 1980s, but the recent activity is pushing into previously untouched corners of Jamanxim National Forest and the Rio Novo National Park.
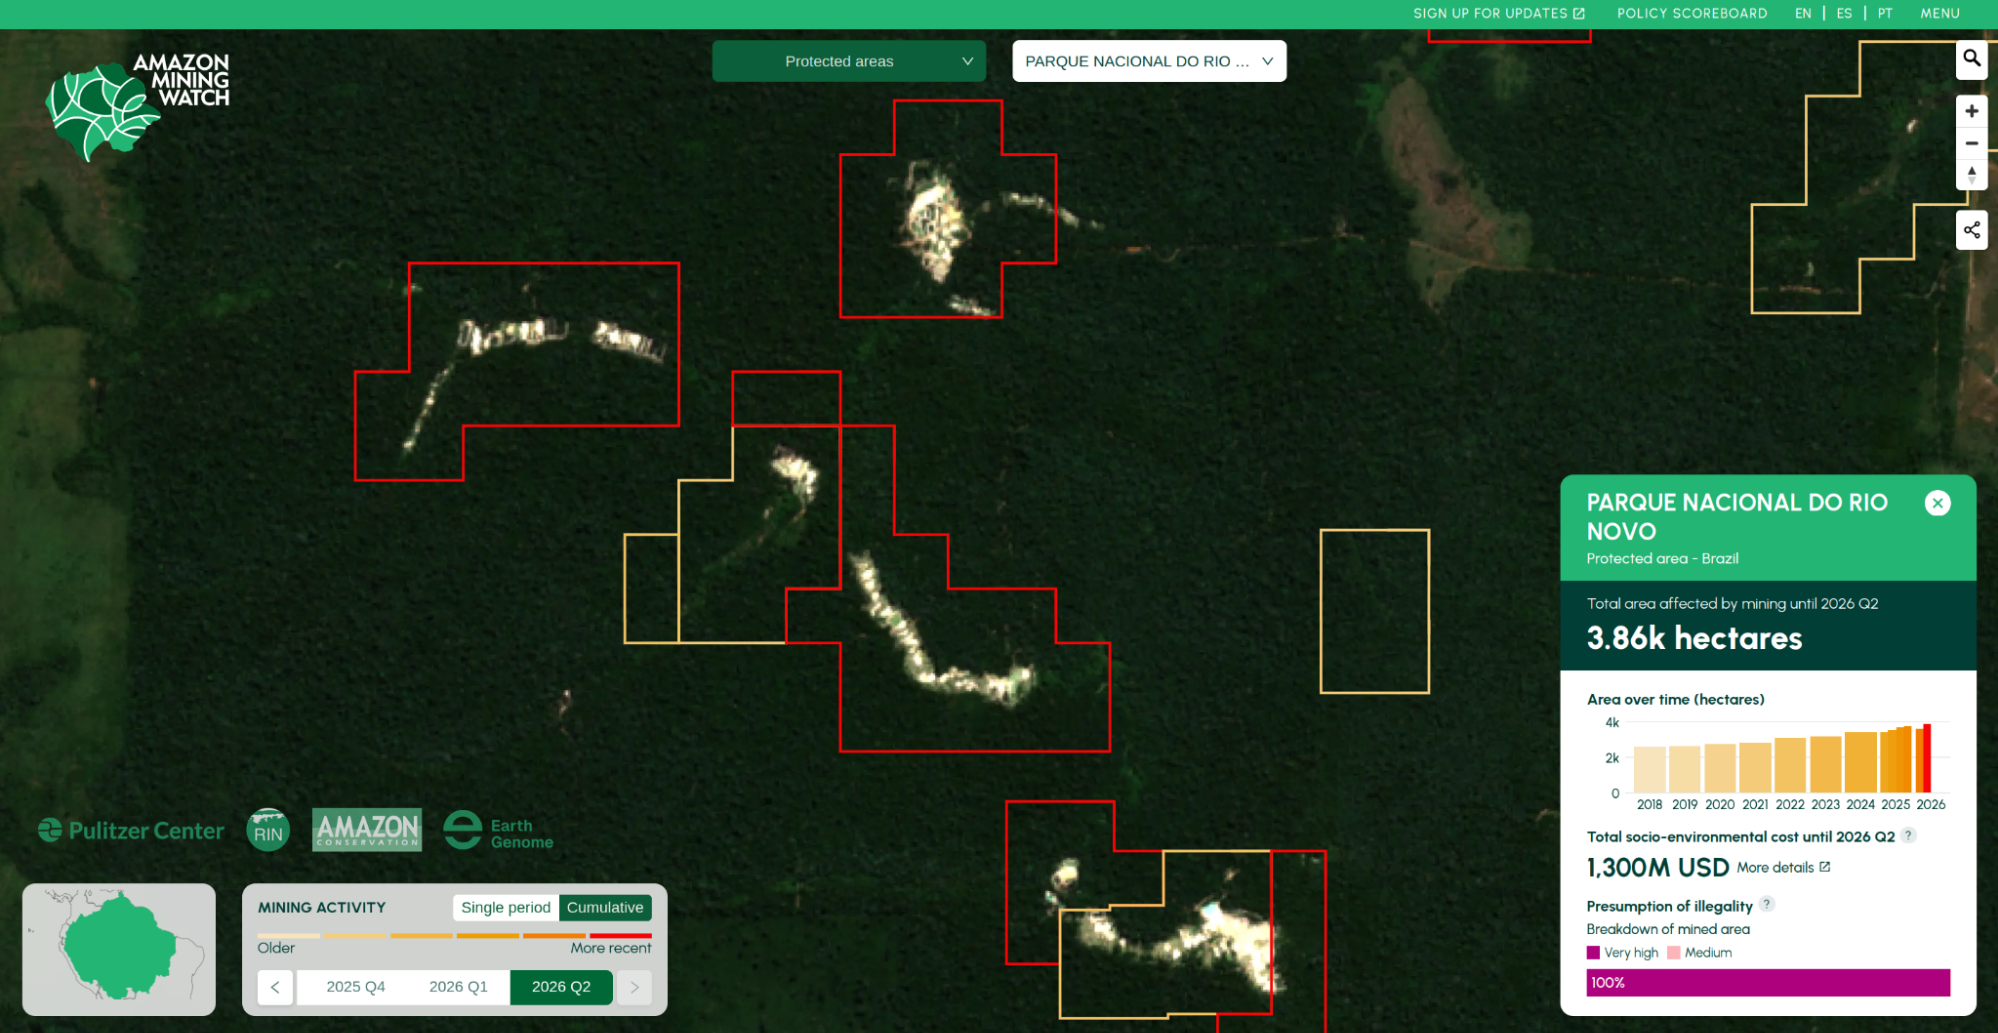
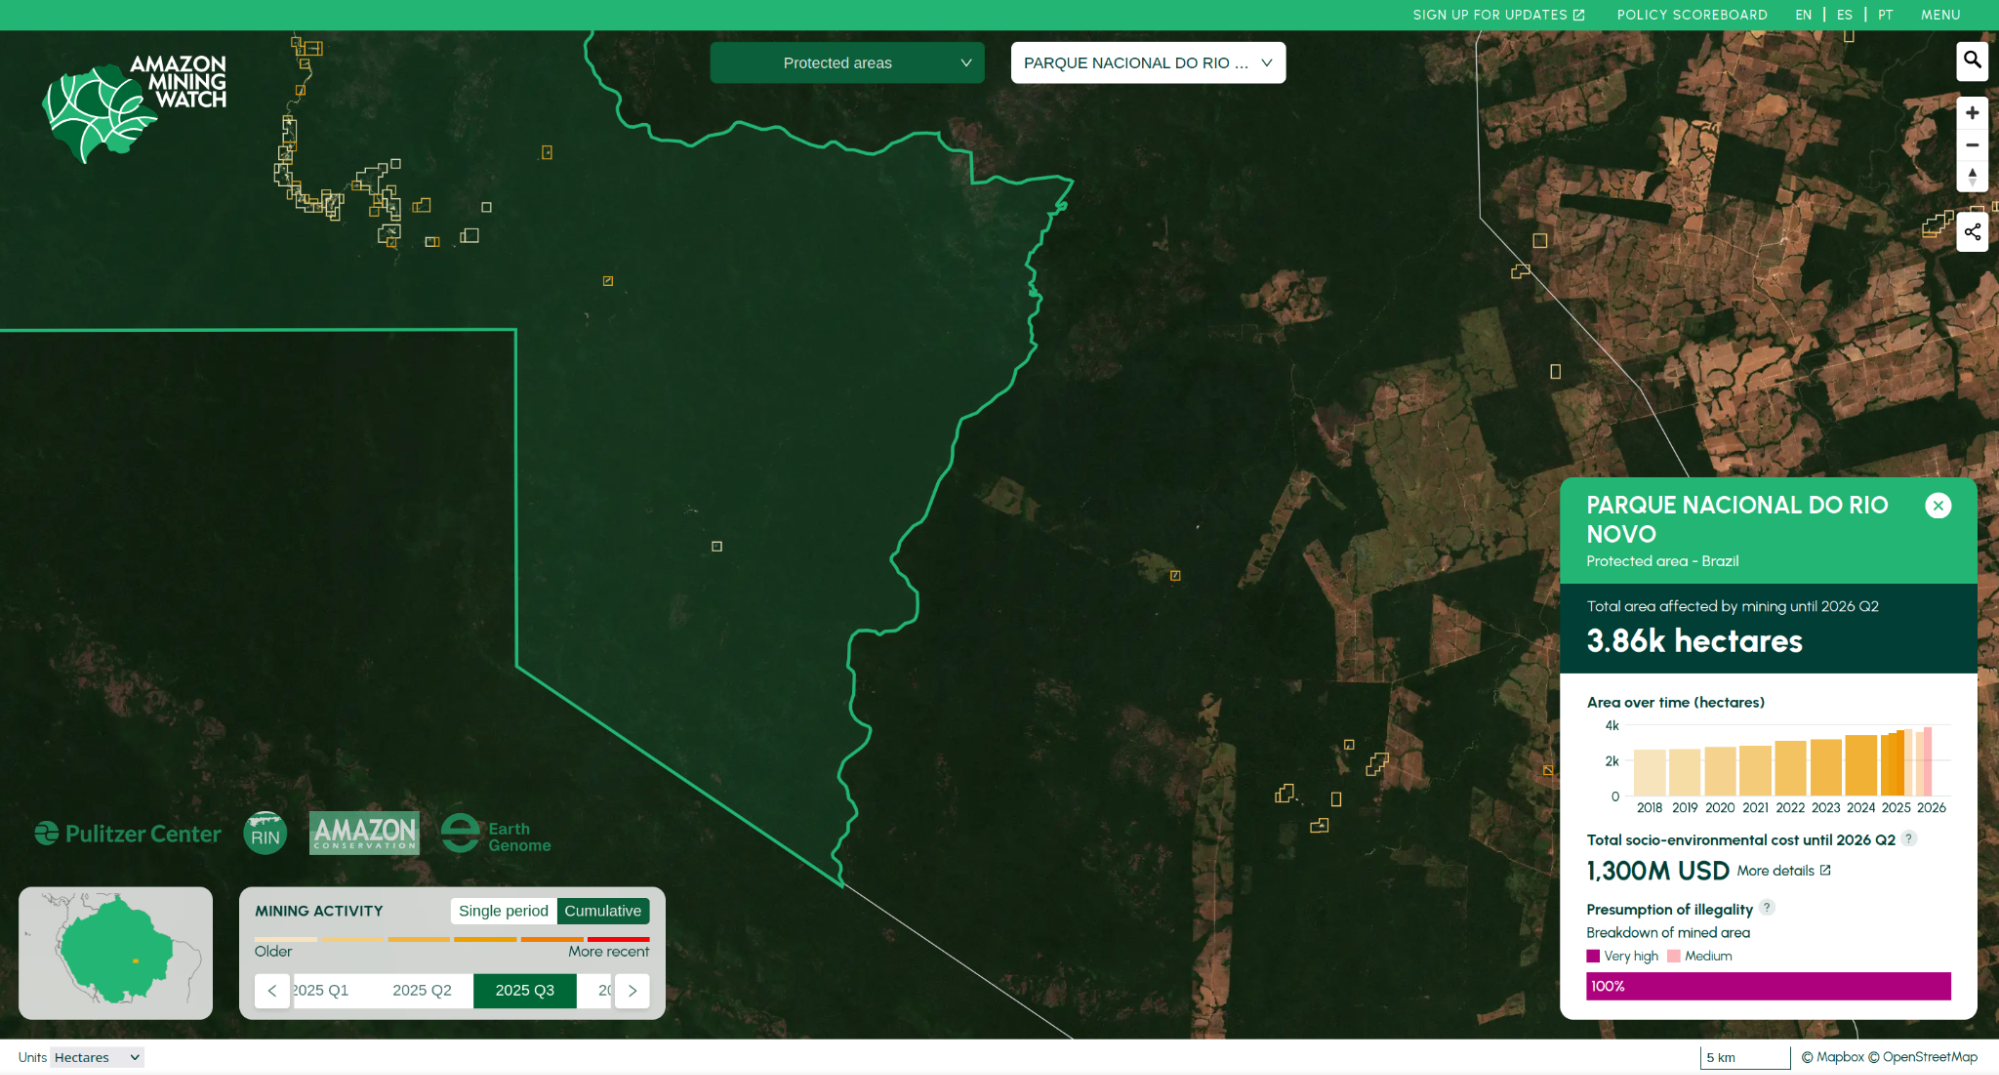
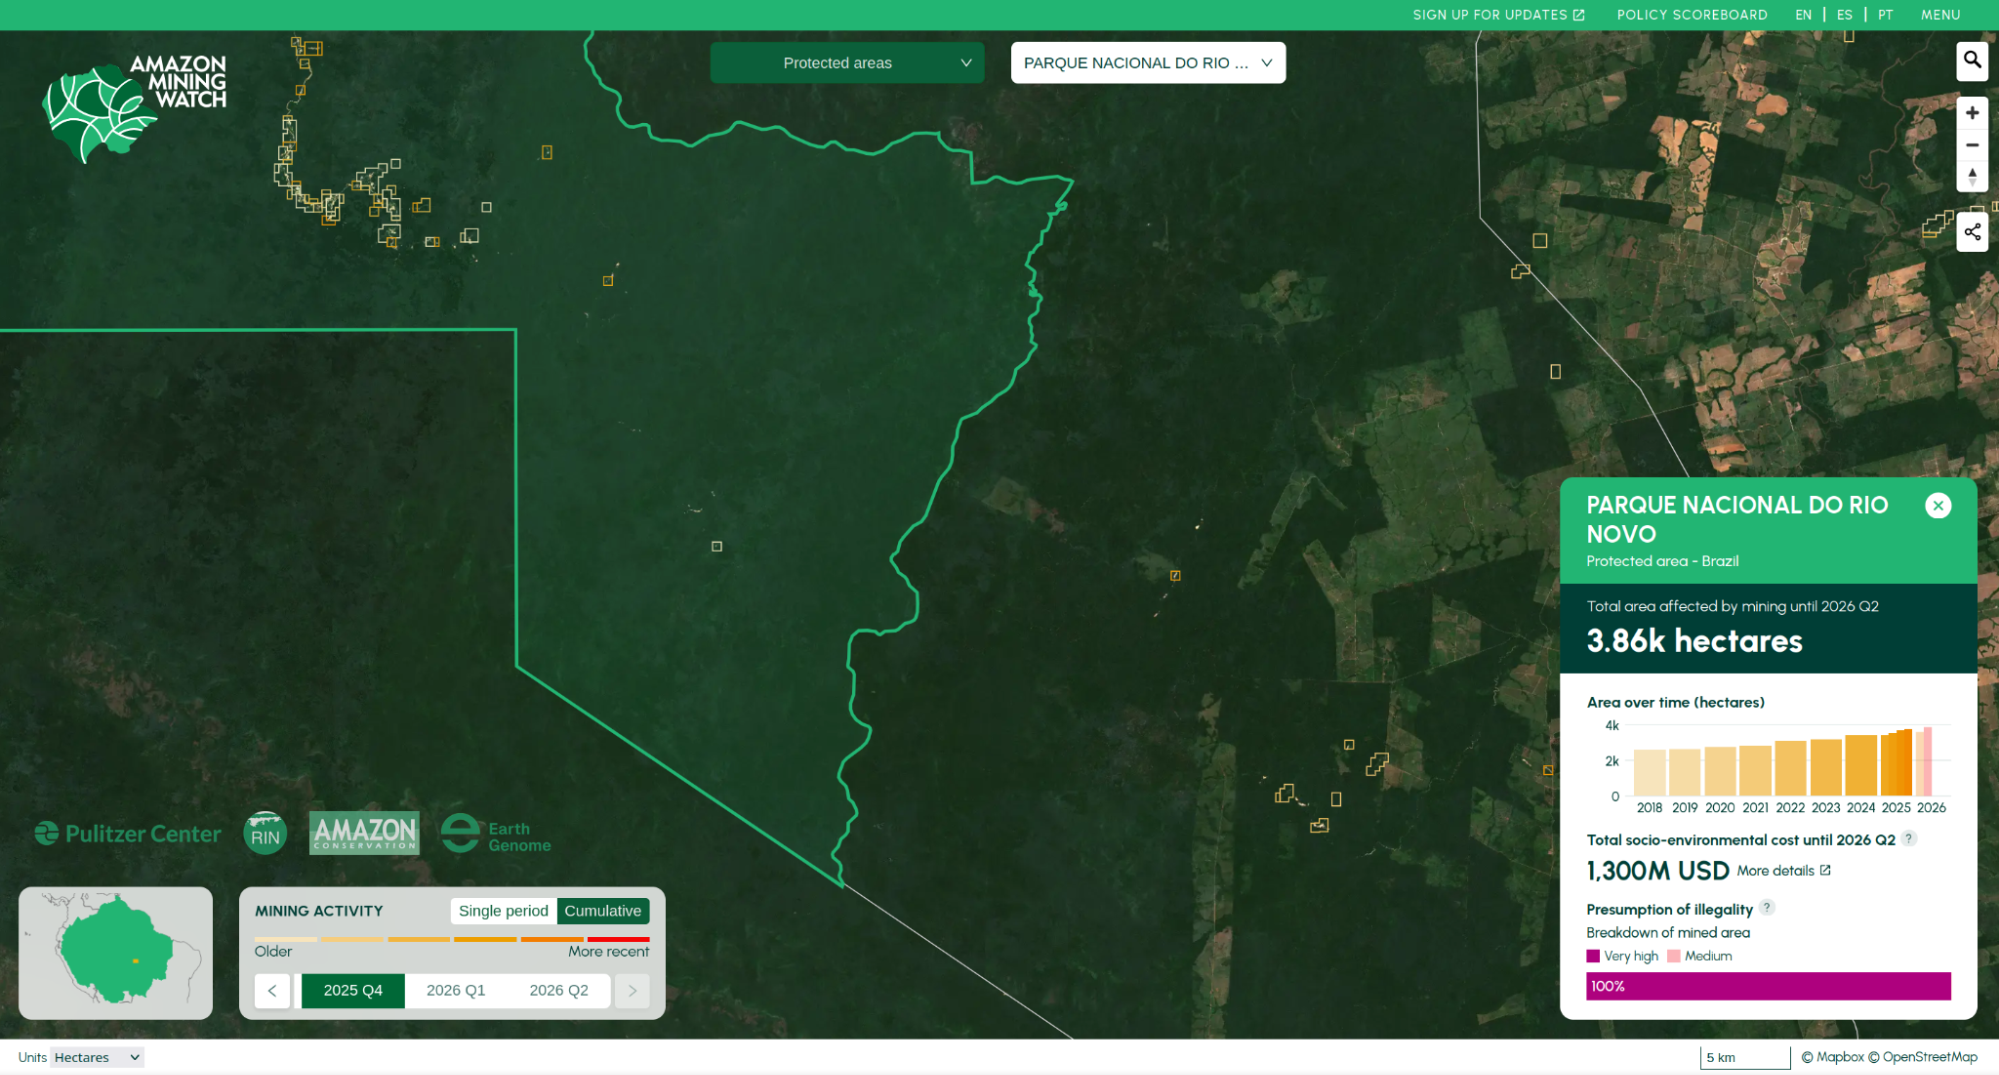
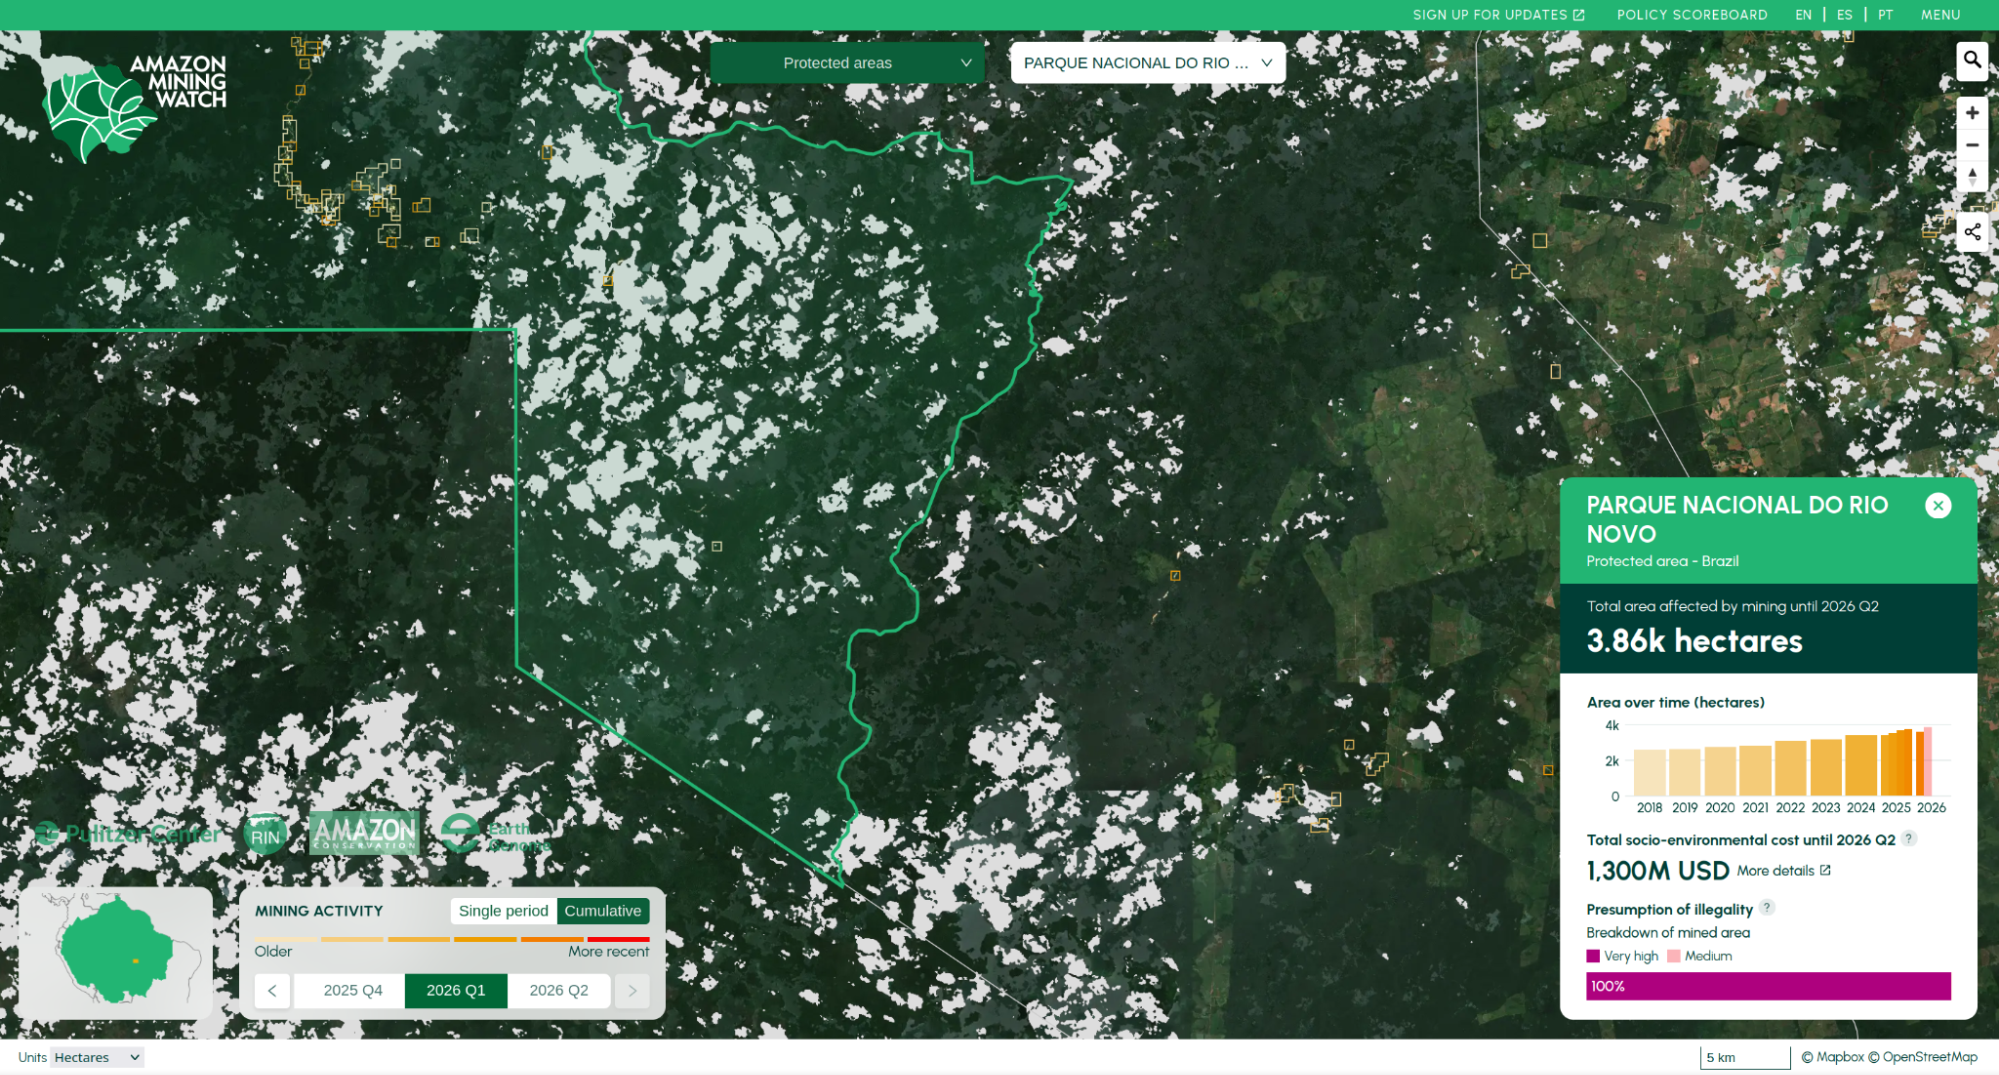
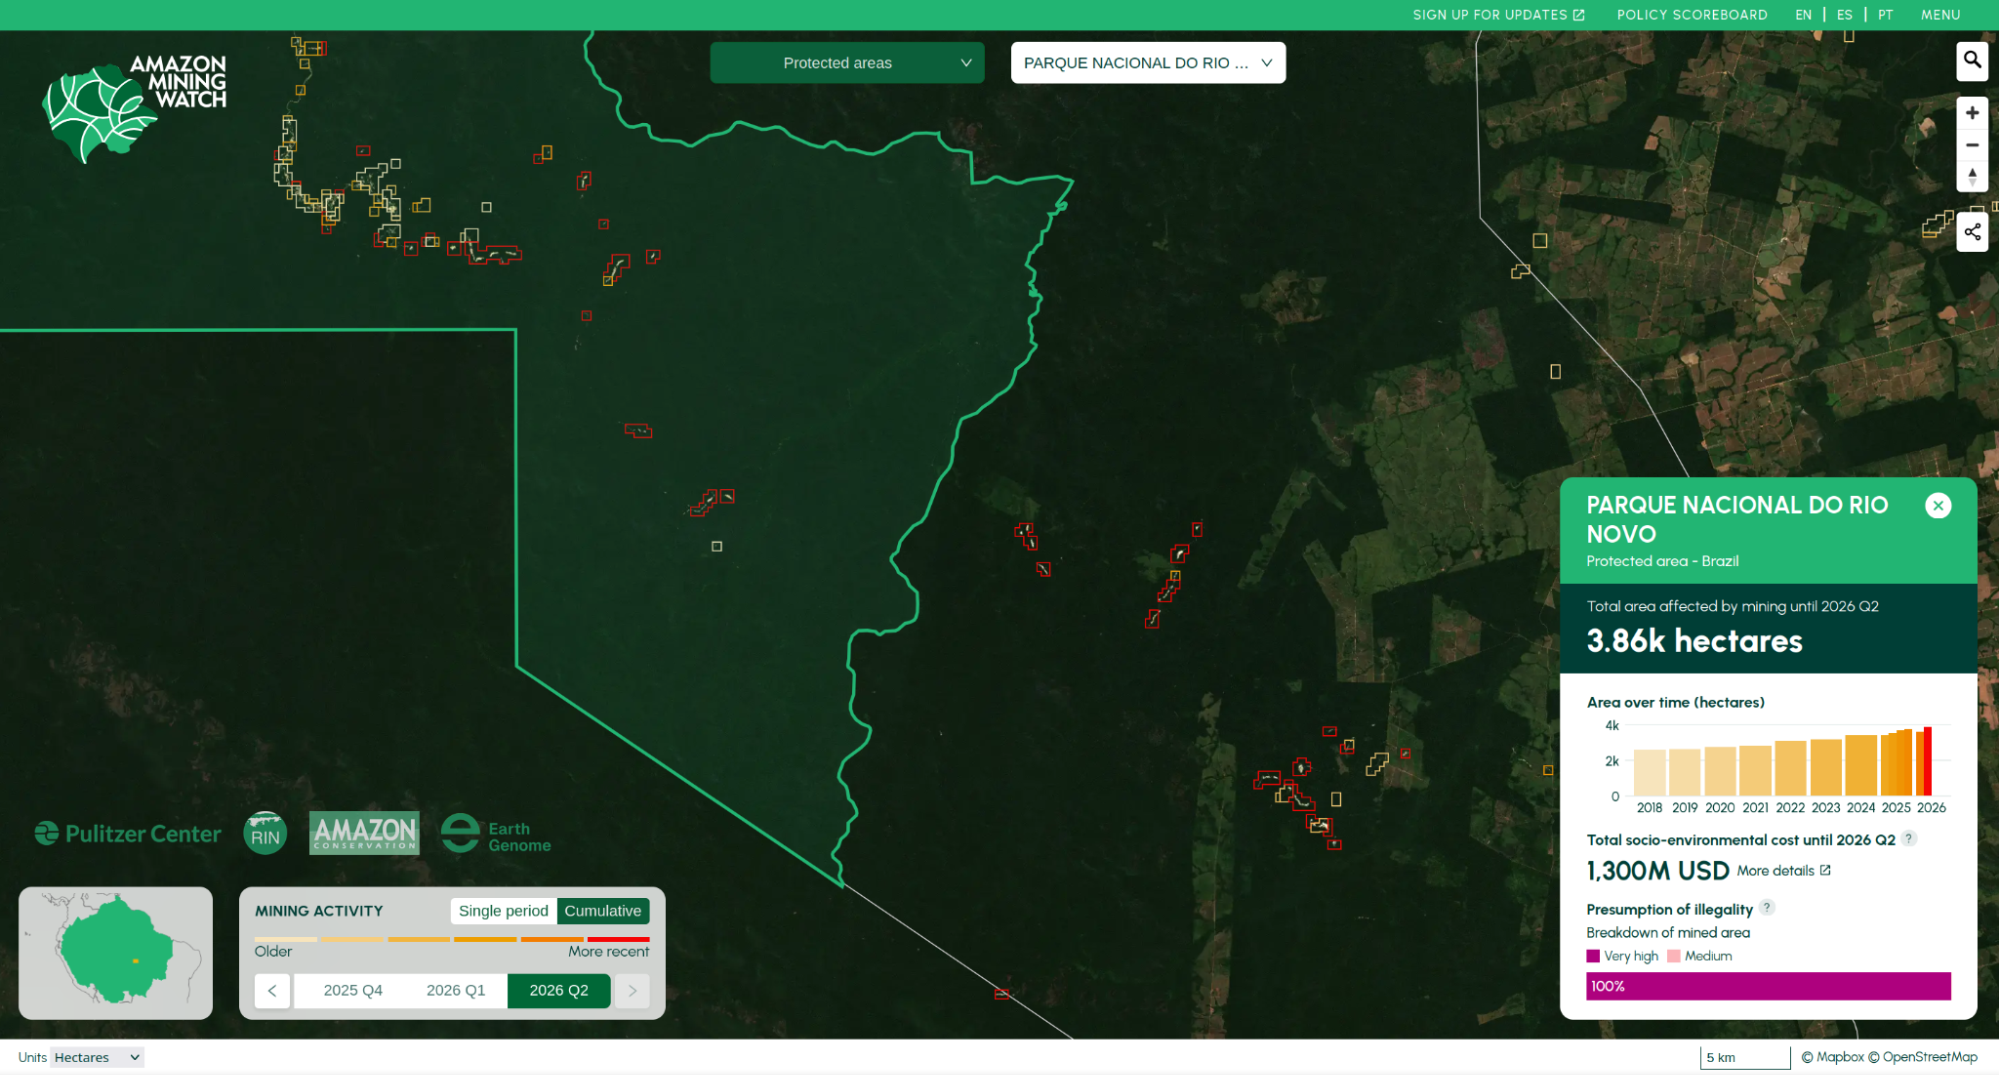
The slider below shows the progression of mining over the past year. Note the distance scale at bottom. In the third and fourth quarters of 2025, we detect scattered signs of mining. A few adjacent mine scars, small bright flecks against the forest background, are not yet substantial enough to register. The beginning of 2026 falls in the cloudiest time of year. The gaps in the imagery for Q1 ‘26 indicate that there were no cloud-free pixels available, even though an image was captured by satellite every five days. The detector runs over the resulting image mosaic, but it can't detect mines without clear views of the ground. In Q2, 2026, the view opens again, and the mines have grown to sufficient size that the new pattern emerges: Across a hundred-kilometer stretch of southern Rio Novo and Jamanxim, perhaps a dozen small streams and tributaries have been gutted by mining.
Mining is still sparsely scattered across southern Rio Novo and Jamanxim. Intervention now could preserve significant tracts of rainforest. The logical end of mining, where left unchecked, can be seen in the exhaustively mined territories to the north (Image 1).
Notes on data and modeling
This work was supported by the Gordon and Betty Moore Foundation, which brought us together with Amazon Conservation Association and many NGOs and Indigenous associations from Amazonian countries to share knowledge and bolster anti-mining advocacy, monitoring, and enforcement. Our task was to improve the sensitivity of our models and to adapt them from yearly to quarterly use. Simple to say, but to borrow a phrase, the quest drew us into a deep, dark forest where 2 + 2 kept coming up 5.
We expanded our training data eight-fold over what we used in 2024. The labeled dataset now comprises 23,463 patches (2,968 mine / ~20,495 not-mine), spanning train, validation, and geographic holdout splits. Sample image chips can be viewed in our training data gallery.
Quarterly outputs on early iterations of this data were… heinous. The western Amazon lit up with false positives that we couldn't suppress with hard negative labeling. Most glaringly, the false detections came from sandbars in rivers flowing down from the Andes mountains and small forest clearings with no mining.
After many tests to tease apart the issues with the data, we arrived at two adaptations:
- We sampled not just negative locations and cloudy scenes, but the specific cloudy patches that triggered false detections, with the same image mosaics we would use in inference. The wispy tails of clouds that escape the cloud masking algorithms brighten river sandbars just so as to let them masquerade as mines.
- We removed some training data, specifically small mines and mines in sandy river bottoms. Below a certain size, 10-m resolution Sentinel-2 data blurs out features that might distinguish between generic forest clearings and mines.
The model scoured roughly 2 billion 23-hectare patches of Sentinel-2 satellite imagery for signs of mining activity, starting in 2018. We present cumulative mining detections on the Amazon Mining Watch website. In our view, that best establishes a historical record of lands impacted by mining since monitoring began. The data are available for download from source.coop.
We tested various model architectures, including convolutional neural networks (CNNs) of different size, ResNet-18, and two systems based on foundation model embeddings with trained probes: Class-token embeddings with Logistic Regression or Multilayer Perceptron probe; and a combined class-patch token embedding system with probe. The class-patch token embeddings yielded the second best metrics on our geographic holdout test sets, intriguing for our embeddings-based work with Earth Index. Ultimately, the 800,000-parameter CNNs trained from scratch gave the strongest performance, and they are lighter weight than a geo-foundation model for inference. Across all architectures, ensembling proved essential to reduce noise.
Two post-processing steps refine the data:
- We found that we could knock down residual scattershot noise by applying a dual confidence threshold based on a simple spatial prior: patches with mine scars tend to cluster. Candidate patches must meet a primary confidence cutoff, and isolated patches, far from other candidates, must meet a higher cutoff. The two-tier rule preserves more true mines than imposing a uniformly strict cutoff.
- A persistence check reduces single-period variance. To enter the cumulative record, a patch detection must be confirmed by a repeat detection in the year following. Meanwhile, recent quarterly data are presented with provisional status. Provisional data will be replaced when confirmed annual detections become available for the relevant time period.
Explore the Data
Access the latest quarterly detections on Amazon Mining Watch, and download data for further analysis. We deeply appreciate everyone working to address the ecological and human crisis of artisanal gold mining in the Amazon, and hope this data update contributes to those efforts.
We thank the Moore Foundation for their support, our partners for sharing data and their deep understanding of gold mining in Amazonia, and the folks at Earth Engine for ensuring we had sufficient data access to complete this survey.
Other articles
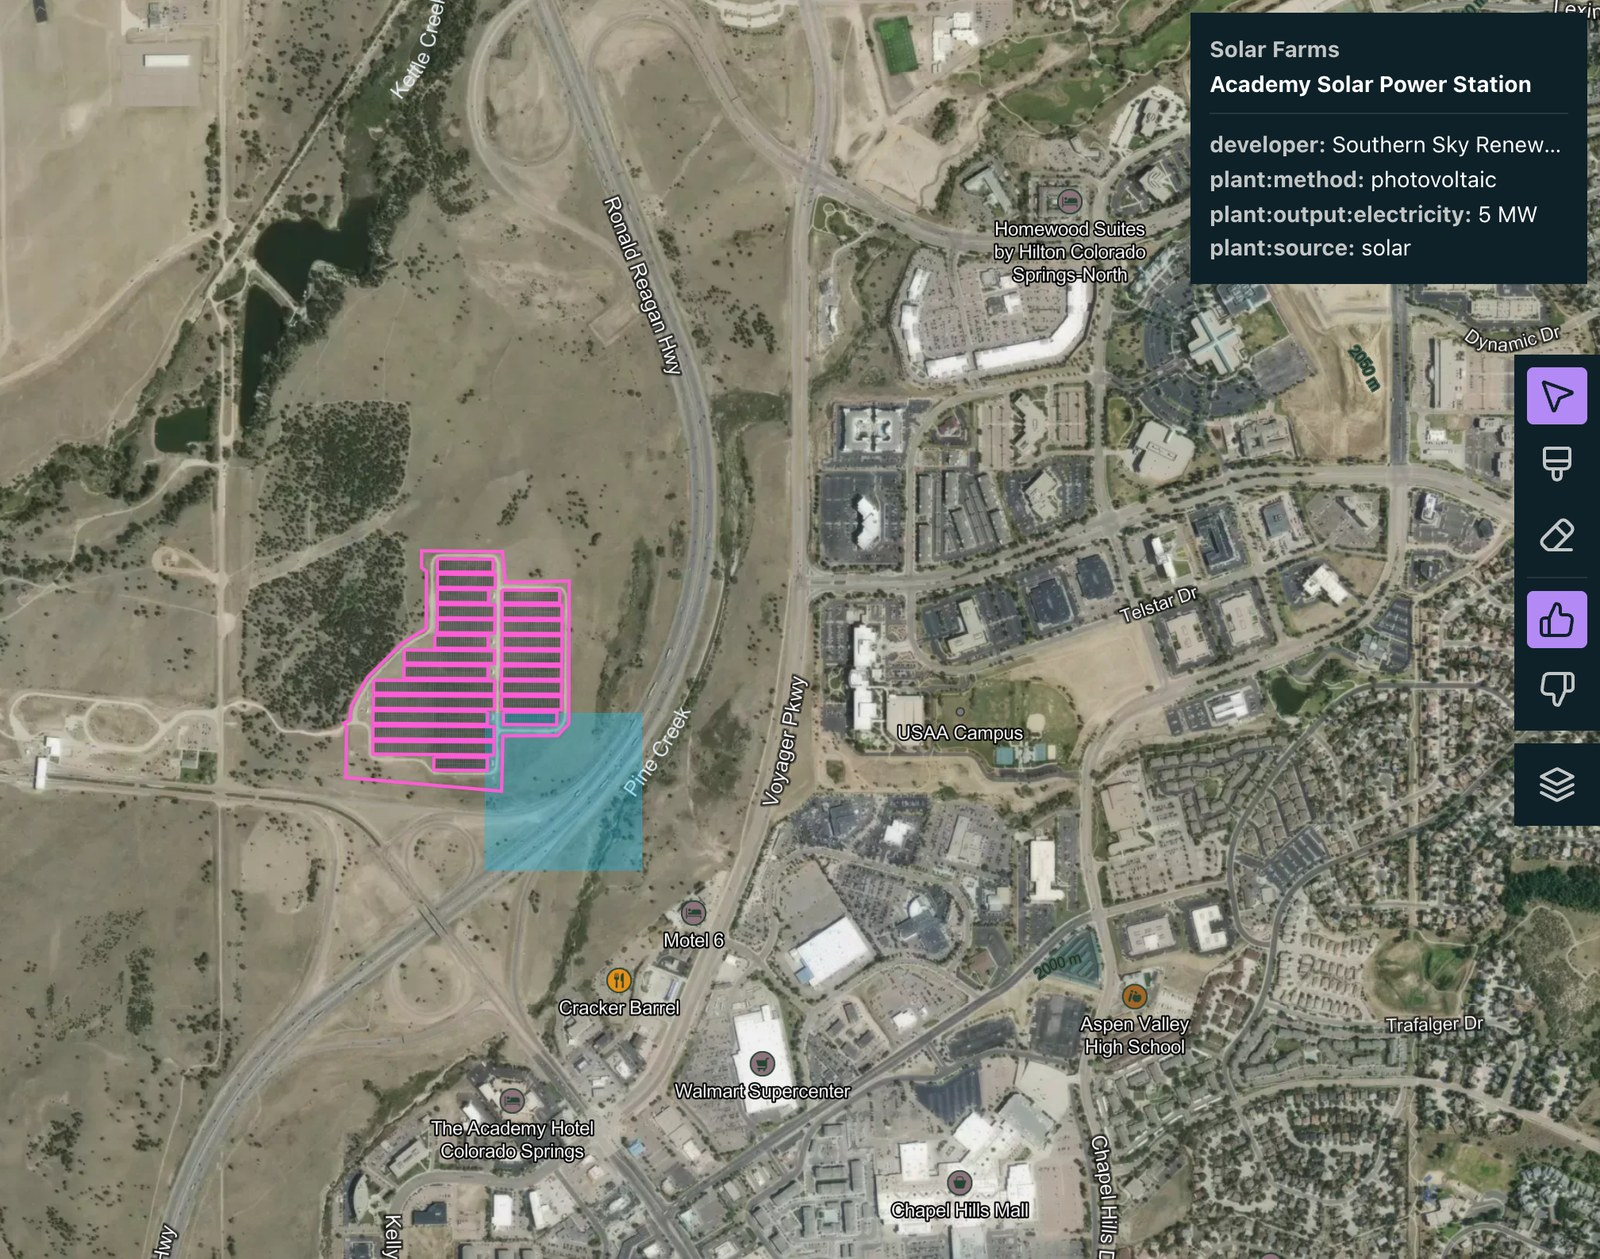
.png)
Search for Stuff: build a map layer by describing what you want to find
You can now create reference layers in Earth Index by describing what you want to find in plain language.

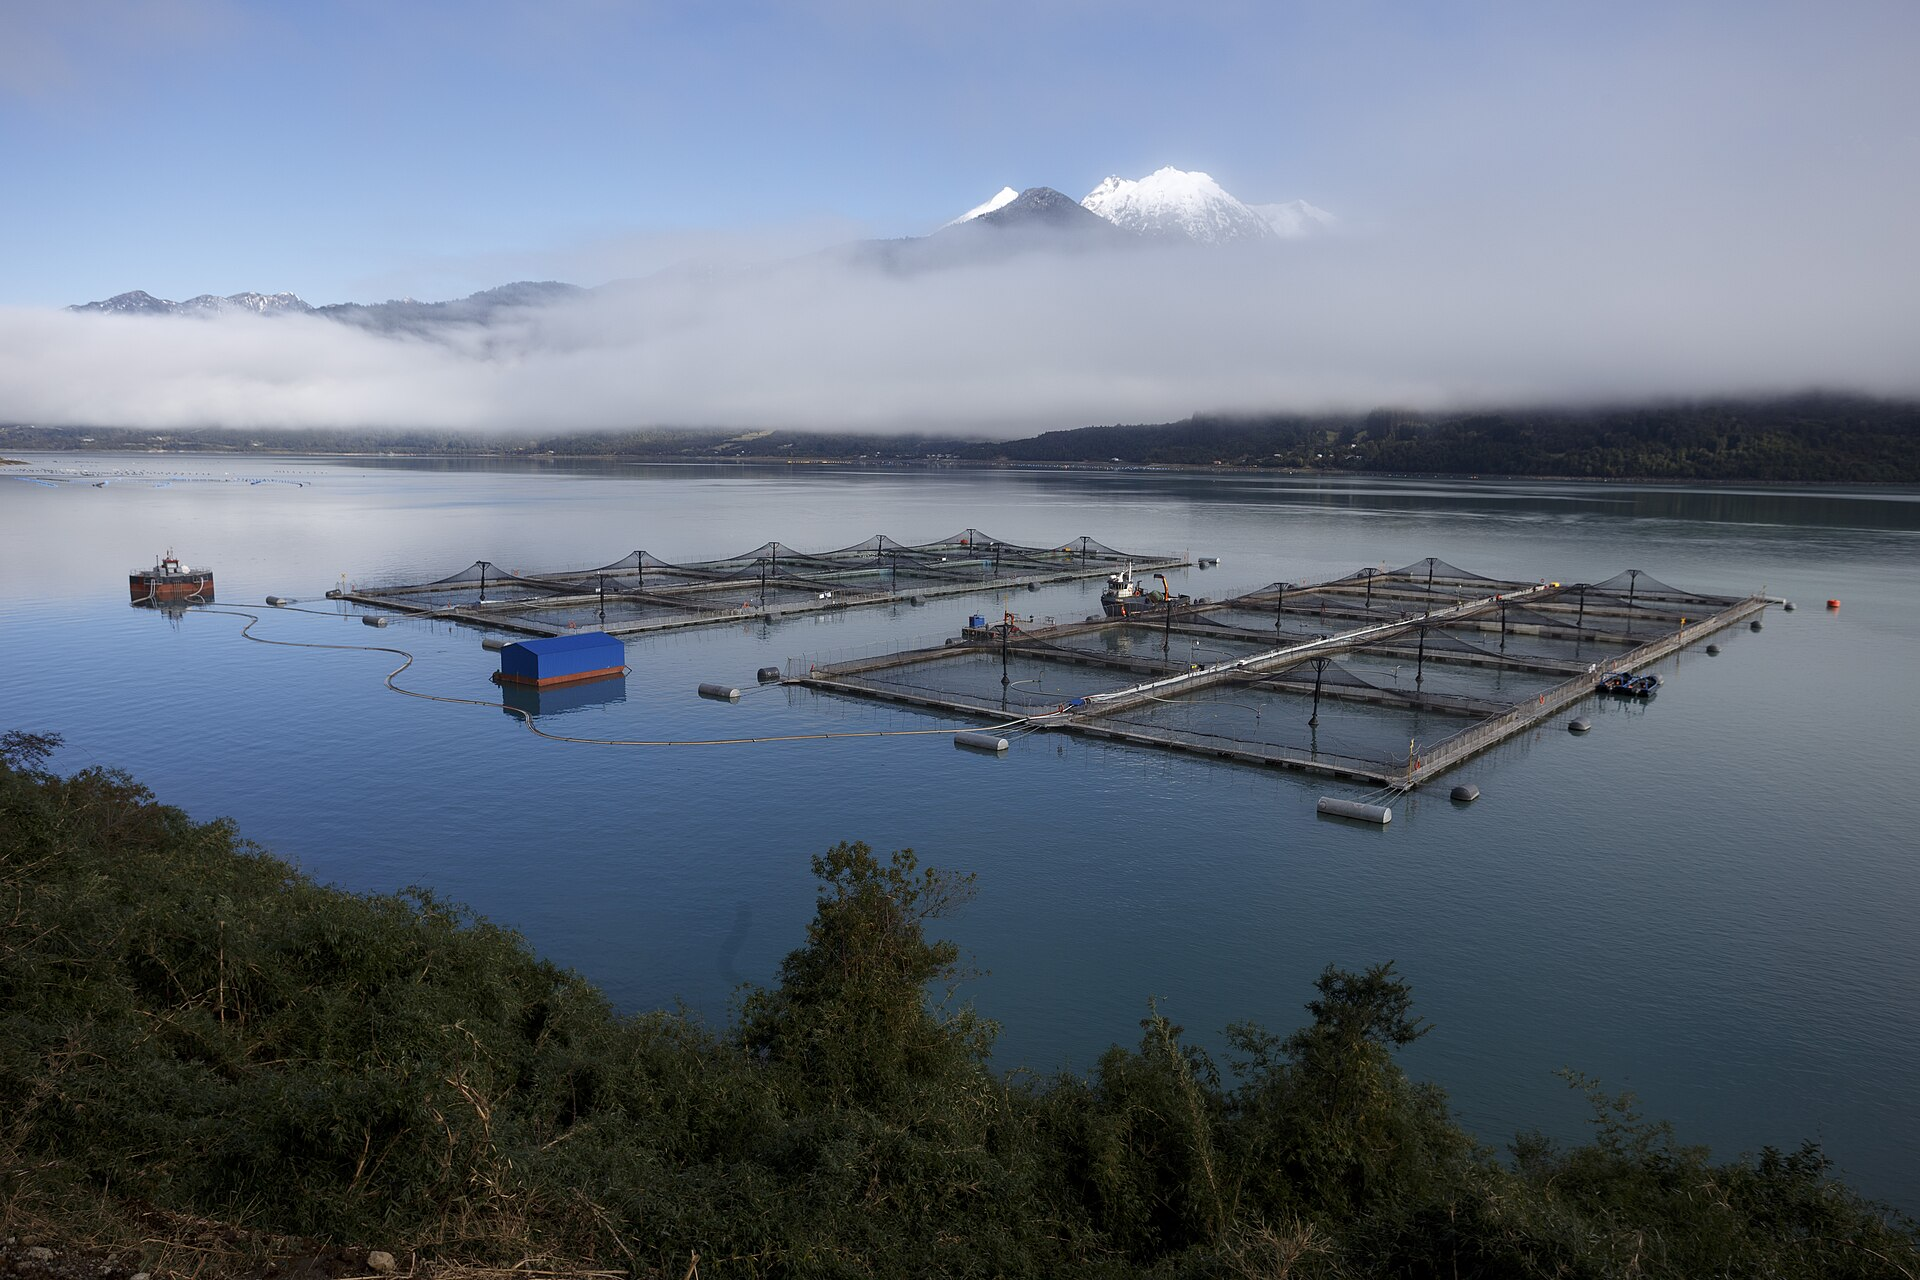
Using Earth Index as an independent validation tool for aquaculture regulations in Chile
Earth Index offers an independent satellite monitoring solution for global aquaculture, empowering regulators, researchers, and non-profits to ensure compliance and sustainable practices.


Two Foundation Models Are Better Than One
A Second-Stage Classifier on AlphaEarth Embeddings, and the Case for Domain-Specific FMs