
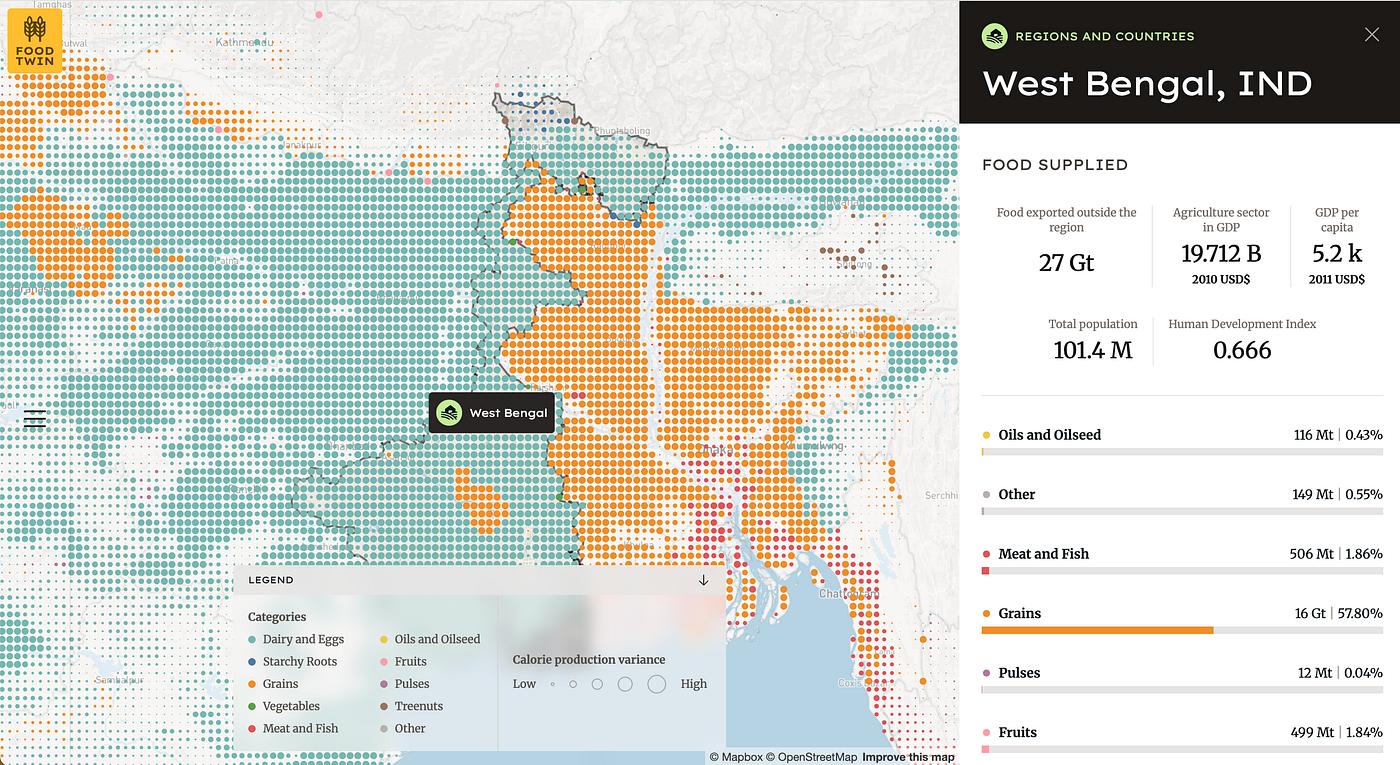
Imagine drought conditions take out 40% of the grain that is grown in West Bengal; where in the world can we expect to see food insecurity? What about if the workers at the ports of Rotterdam go on strike; where should global leaders direct food resources to reduce the impacts to downstream consumers?
Answering these types of questions just got easier. Earth Genome and Better Planet Laboratory are proud to announce the launch of Global Food Twin, an ambitious expansion of our food system digital twin that now models supply chains across the entire world’s food system. Building on the success of our US-focused proof of concept, we created a model of food production, consumption, transportation infrastructure, and trade of food resources across the globe. Today we are open sourcing the data, model and proof of concept application for all to access
This model and the proof of concept Food Twin app reveals major risks in our food system. Roughly 9% (~350) of sub-national administrative units account for 80% of global caloric flows. Small impacts in the wrong areas will cause downstream impacts that ripple around the globe. When analyzing transportation pathways, similar concentrations are seen in major maritime, road, and rail routes. Beyond risks, analyzing food systems end to end through these new data can help us prepare and proactively build more resilient food systems for the future.
This project was supported by a grant from Climate Works Foundation. Credit to Development Seed who built the majority of the web application; Zia Mehrabi with the vision behind this concept; Ginni Braich who developed the supply and demand data; Kushank Bajaj who developed the transportation and flow data; and Jasper Verschuur assistant professor at Delft University whose work on supply chain mapping we built on to develop this model.
Key Resources
- Proof of concept Global Food Twin web application
- All data produced by the model
- Methodology and code for the model
- Application exposing impacts of regional production deficits
From National to Global: The Evolution of Food Twin
When we launched the US Food Twin last year, we always intended to expand our vision beyond national borders. Food systems don’t exist in isolation — what happens in Brazil’s soybean fields affects dinner tables in Beijing, and drought in Australia ripples through global wheat markets. Our new Global Food Twin captures these complex relationships, giving us unprecedented visibility into how food moves around our planet.
Most of us have no idea where our breakfast comes from or who grows it. This disconnect becomes even more pronounced when we consider international food systems. The coffee in your cup might come from Ethiopia, the bananas in your cereal from Ecuador, and the cereal itself is made from wheat grown across multiple continents. Global Food Twin illuminates these connections, tracking calories from farm to fork across oceans and borders.
The Architecture of Global Food Twin
The Global Food Twin represents a significant advancement in modeling complexity. While our US model focused primarily on plant-based foods within national borders, our global model integrates:
- Production across ecosystems: Crops from farmlands, animal products from pasturelands, and aquatic food sources from oceans and freshwater environments
- Multi-modal transportation: Maritime shipping routes, railway networks, road transportation, and inland waterways
- International trade flows: Bilateral trade relationships between countries and subnational regions
- Cultural and economic factors: Different dietary patterns and economic access to food across regions
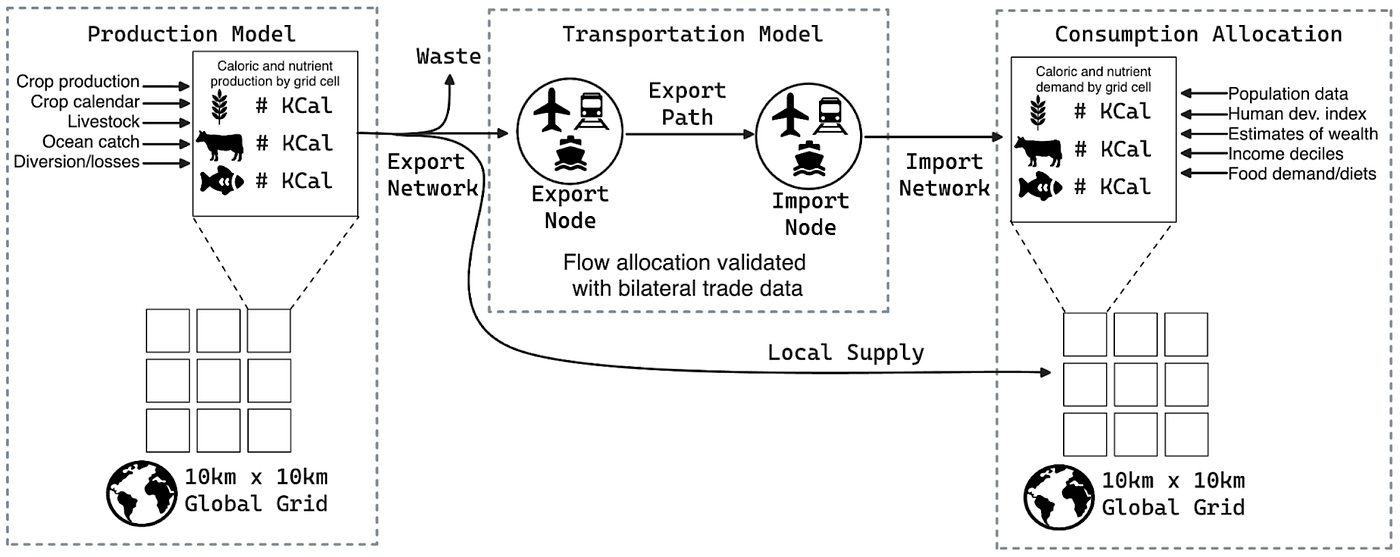
Production Model
Our production dataset integrates multiple sources organized into 10km x 10km grid cells across the entire planet. We track total mass (kg), calories (kcal), and macro-nutritional content (fats, carbohydrates, proteins) of all crop, aquatic, and livestock commodities produced normalized to 2020 levels.
Key data sources include:
- CropGRID’s global yields and production for 160 crops
- Global crop calendars showing planting and harvesting dates
- FAO livestock density data for 8 major species
- FAO global catch data for aquatic food sources
Demand Model
Our demand model is a simple population driven estimate (that we found works well for the scale of our supply chain allocations, see our repo for more information), and matches production to consumption needs based on:
- Culturally relevant diets and caloric requirements in each region
- Population density at a fine-grained resolution
- Nutritional transitions occurring in different regions
Trade Model
One key advancement in our global model is the trade component. In collaboration with Dr. Jasper Verschuur, we simulated maritime and hinterland routes connecting 3787 subnational regions across 240 countries. Our data now represents food flows alongside all major transportation infrastructure in the world — with a level of fidelity and detail, never before achieved.
This has allowed us to:
- Calculate least-cost flows between production and consumption regions
- Model multi-modal transportation of 82 commodities including transshipments
- Identify port-to-port connections for three unique vessel types (bulk, container, general)
- Visualize dependencies on critical maritime, rail, road, inland waterways infrastructure
Application Design
The design of the application was a feat within itself. Working with our partner Development Seed we took on an extensive design sprint. We detailed our learnings and vision in this blog post.

The basemap is one of the more interesting parts of the application. We’re big fans of dot maps here at Earth Genome. This particular basemap was designed by taking the production data for each 1km x 1km grid cell and comparing all 82 food groups in the model. We calculated the variance of each production value and displayed the value with the highest variance as a colored dot. The color of the dot represents the most “unique” type of production in that region; the size of the dot represents how much total production occurs in that region for that particular food type.
Key Insights from Global Food Twin
Similar to our US Food Twin, the global model reveals insights about a brittle global food system. The centralized production and bottlenecks in transportation are a visualization pointing to how we can prepare for shocks and disruptions and make a more resilient food system globally.
Here are a few of the insights from the model:
- Our exports analysis capture 13.2M unique flows between 3787 admin1 units and for 82 food groups
- Just ~17,500 bilateral trades are responsible for half of the global export volume, this is only 0.13% of all export flows
- 100 largest bilateral flows are 6.7% of all export volumes, largely soyabean (2/3s of these trades), then maize, wheat and sugar
- Exports from Brazil to China is the largest volume of trade, represents almost 4% of all global export flows, USA to China is second, representing 3.3% of all global export flows by volume
- Exports to China represent 15% of all global flows
- The 5 largest exporters by volume are USA, Brazil, Canada, Argentina and Ukraine
- The 5 largest importers by volume are China, Germany, Netherlands, USA and Japan
- Egypt is the largest importer of wheat in the world, also a prominent re-exporter of wheat to Africa (Tunisia, Chad, UAE, Kuwait)
- 64.5% of all exports are by sea/hinterland, 24.8% by rail, 9.7% by road and 0.9% by Inland Waterway
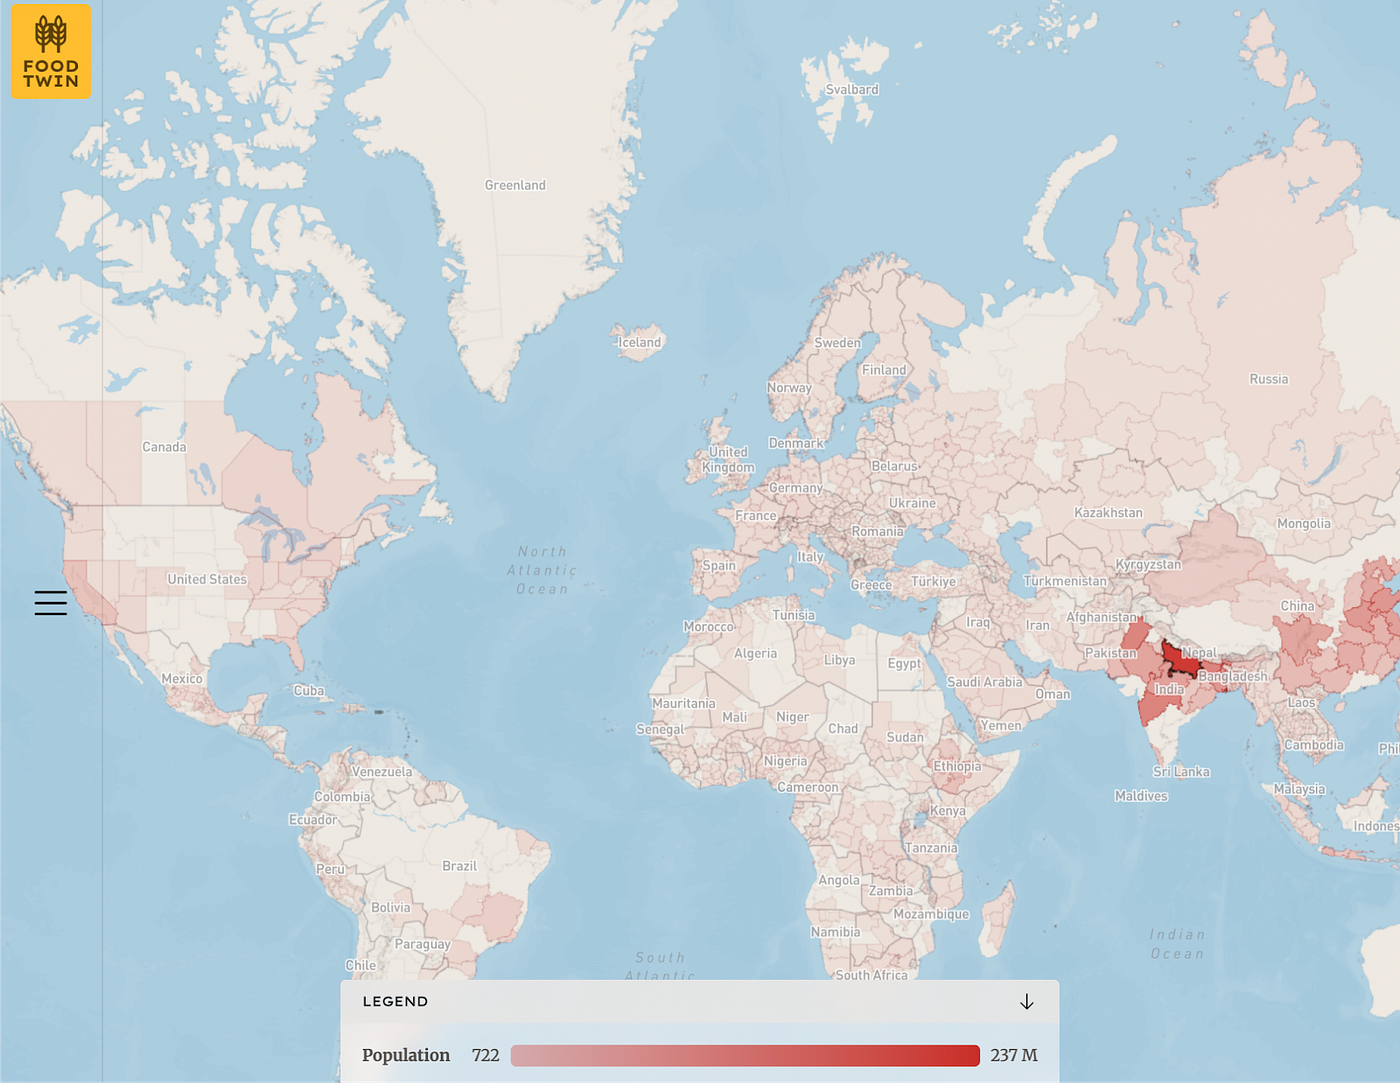
Concentrated Production Meets Global Demand
While the US model showed that just 5.5% of counties produce half the nation’s food, the global picture is even more concentrated. Globally, just 1.2% of regions are responsible for 50% of the world’s grain supply; this concentration creates critical vulnerabilities in our food supply. For example, let’s take Uttar Pradesh’s exports. Our model predicts that this region alone provides the yearly calories for 165 million people around the world. This can be seen clearly in the impact view of the application. All highlighted regions receive food exports from Uttar Pradesh.
Chokepoints in Global Food Transportation
The global model highlights critical chokepoints where disruptions could have cascading effects. Key maritime passages like the Suez Canal, the Panama Canal, and the Strait of Malacca handle significant portions of the world’s food trade. This can be seen in the app when looking at a region like Castile and León in northern Spain. This region exports 8 Gigatons of food worldwide, but it can be seen that many of the meat exports going to Asia travel through the Suez Canal. Even small disruptions to individual shipping lanes can cause major impacts to those expecting these shipments.
Further visualization can be done using the full data set to explore which ports, rail lines, roads, and maritime routes are the most critical and most at risk of disrupting food systems.
Vulnerability to production shocks
Climate impacts combined with conflicts and global trade shocks cause major impacts to food systems that reverberate around the globe. Heat stress and drought events that impact single regions trigger worldwide price spikes and food insecurity.
Global conflicts provide a clear example of these dynamics. The map below shows a major grain-producing region in Ukraine that exports over 4 gigatons of food annually, primarily grain. This visualization reveals why Russia’s invasion of Ukraine had such effects on global grain markets, disrupting both production and export channels from this critical agricultural hub.
Further analysis on the impacts of eliminating individual regions can be done in this tool.
Applications of Global Food Twin
The Global Food Twin represents not just an academic exercise but a practical tool for addressing food security challenges.
Climate Resilience Planning
By modeling how climate shocks propagate through the global food system, we can identify vulnerable communities and develop targeted interventions before crises occur. Policymakers can use these insights to diversify food sources and strengthen local production where appropriate.
Supply Chain Optimization
Food companies and distributors can use our model to evaluate supply chain risks and identify more resilient sourcing strategies. This could lead to more stable food prices and fewer disruptions in availability.
Food Security Policy
International organizations focused on hunger and food security can better target their efforts by understanding the complex interdependencies of global food systems. Our model helps identify which regions are most vulnerable to various types of shocks.
Join the Effort
The Global Food Twin, like the US Food Twin, is built on principles of open data and community collaboration. We invite researchers, policymakers, industry leaders, and concerned citizens to engage with this model and contribute to our understanding of global food systems.
Here’s how you can get involved:
- Explore the System: Dive into our interactive visualization and explore global food flows.
- Use the Data: We’ve open sourced the data we use in this application. Use this in your projects and be sure to let us know how you use it.
- Contribute expertise: If you’re a researcher, we welcome collaborations to refine and expand the model.
- Share insights: Help spread awareness about food system vulnerabilities in your community and globally.
- Support local resilience: Use these global insights to better understand how food systems work. Local food networks are the secret to a resilient food system; support your local food network and be part of the solution
- Get in touch: If you have ideas or want to collaborate, we’d love to hear from you. Reach out to us here.
The Road Ahead
While this global model represents a significant advancement, our work is far from complete. Future development will focus on:
- Higher temporal resolution: Move to monthly, weekly, or even daily timesteps to capture rapid changes
- Production shock modeling: Integrating climate projections, global conflict, or other impacts to anticipate future disruptions
- Policy simulation: Building tools to test how policy interventions might impact food security
- Nutritional quality: Moving beyond calories to better model micronutrient flows through the system
We also invite the community to join forces to develop an application that allows users to simulate shocks to the system.
In a world where climate change and geopolitical tensions increasingly threaten food security, tools like the Global Food Twin are essential for building resilience and ensuring that nutritious food remains accessible to all. By making the invisible visible, we hope to inspire action toward a more sustainable and equitable global food system.
Other articles

.png)
The AI Knowledge Problem
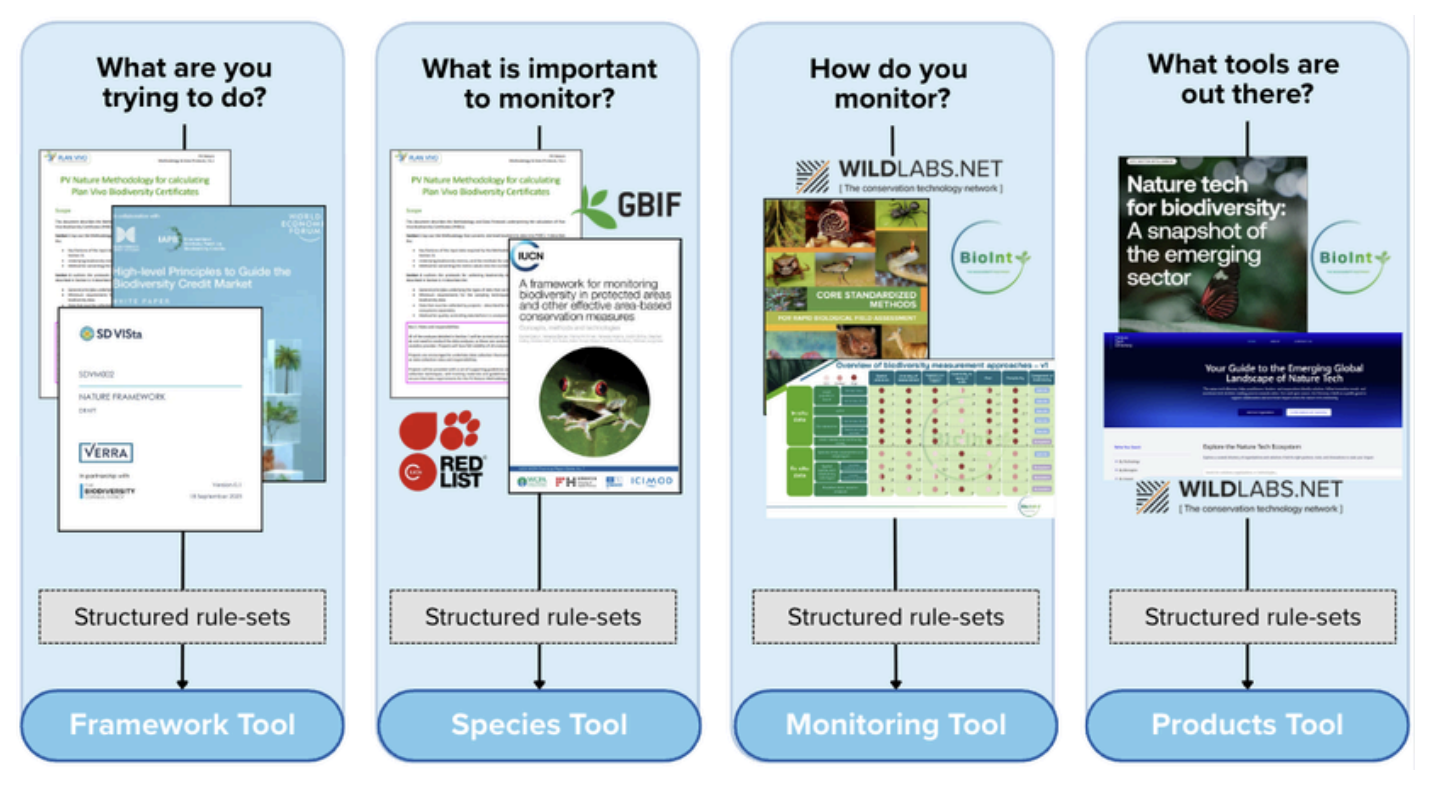
Report out on building decision support tools for nature credit project design
.png)

Engineering updates on sustainable AI at Earth Genome
Behind the scenes sustainability improvements on patch grid generation, STAC metadata, energy transparency, and DB optimization.
