As remote sensing foundation model embeddings become more mainstream, we’re entering interesting new territory where there is increasing attention paid to not just how to create embeddings but also how to use them. Tools like Earth Index, which make it easy to interact with embeddings through a UI, are clearly part of the solution. (See our paper on the role of digital apps.)
In addition to the apps layer, there is an emerging opportunity to explore the embeddings layer itself. Sometimes a given problem requires remixing embeddings, to better understand problems at a different spatial or temporal scale than how an embeddings dataset was originally produced.
A recent example we have tackled involves AlphaEarth, Google’s embeddings dataset. AlphaEarth embeddings are available at 10m resolution, a useful resolution for many applications. However, we faced a problem when trying to adapt AlphaEarth embeddings for use in Earth Index. Earth Index makes the planet searchable by tiling the Earth into 320m tiles. So the question we faced was: how can we aggregate 10m pixel level embeddings into a single 320m tile embedding?
We attempted two strategies for this aggregation work:
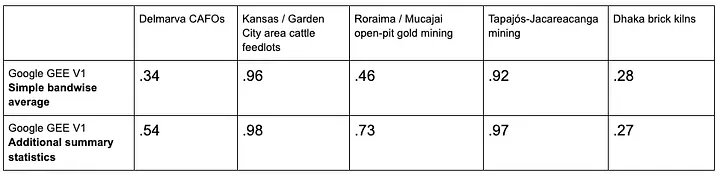
- Simple bandwise average: A simple bandwise average over all 10m pixels within a tile. This is the strategy that Google suggests for the problem. This results in a 64 dimensional tile embedding.
- Additional summary statistics: A strategy that includes additional bandwise summary statistics over a tile: mean, standard deviation, min and max. This results in a 64 x 4 = 256 dimensional tile embedding.
The results from our benchmarking tests on several datasets are listed below. The table reports a measure of retrieval quality, precision@250, where we construct a query vector from random positive examples and test what fraction of its 250 closest neighbors belong to the positive class. This process is repeated over many trials to get an average precision@250 value.
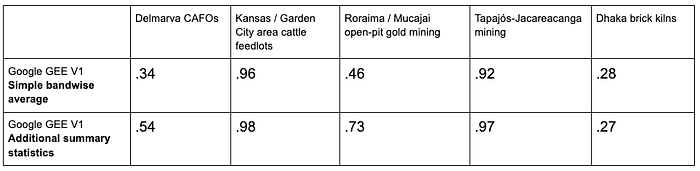
I had a hunch that the additional summary statistics would outperform the simple average; after all, they contain strictly more information. Interestingly, the effect of adding additional summary statistics seemed to vary depending on the particular problem that we tested. Some problems were pretty easy for the simple average already, resulting in benchmark saturation or small improvements with additional statistics (“Kansas / Garden City area feedlots” and “Tapajós-Jacareacanga mining”). The “Dhaka brick kilns” benchmark showed similar results on either method, indicating that this problem might require innovations beyond embedding aggregation strategies.
For two problems, “Delmarva CAFOs” and “Roraima / Mucajai mining”, we saw impressive improvements in performance with additional statistics. This indicates that the AlphaEarth pixel-level embeddings that are contained in these tiles must have some diagnostic distribution that is not captured by simple averaging alone. For the Delmarva CAFOs data, for example, an individual poultry CAFO might be a small overall percentage of pixels in a tile. The CAFO “signal”, then, could be averaged out by doing a simple average over the tile.
Other problems to explore in combining embeddings
In addition to the tile aggregation problem, there are many other problems that we’re eager to continue to explore in the embeddings layer, including:
- Change over time: How can you compare embeddings from two different time periods?
- Dimension reduction: How can we effectively squeeze high dimensional embeddings into smaller ones?
- Cross-model combinations: What steps can we take to combine embeddings from different models (including across sensors), in order to leverage their unique strengths?
- Context window/tile size: Should we adjust the 320m tile size we have used in Earth Index?
- Embeddings fields: AlphaEarth already incorporates spatial context into each 10m embedding. How can we determine what is being captured in this context?
Have you faced similar challenges in working with embeddings? Reach out! We’d love to collaborate.
Other articles
.png)
The AI Knowledge Problem
Report out on building decision support tools for nature credit project design
.png)

Engineering updates on sustainable AI at Earth Genome
Behind the scenes sustainability improvements on patch grid generation, STAC metadata, energy transparency, and DB optimization.