.png)
Food
Product design
Visualization / data storytelling
Policy makers
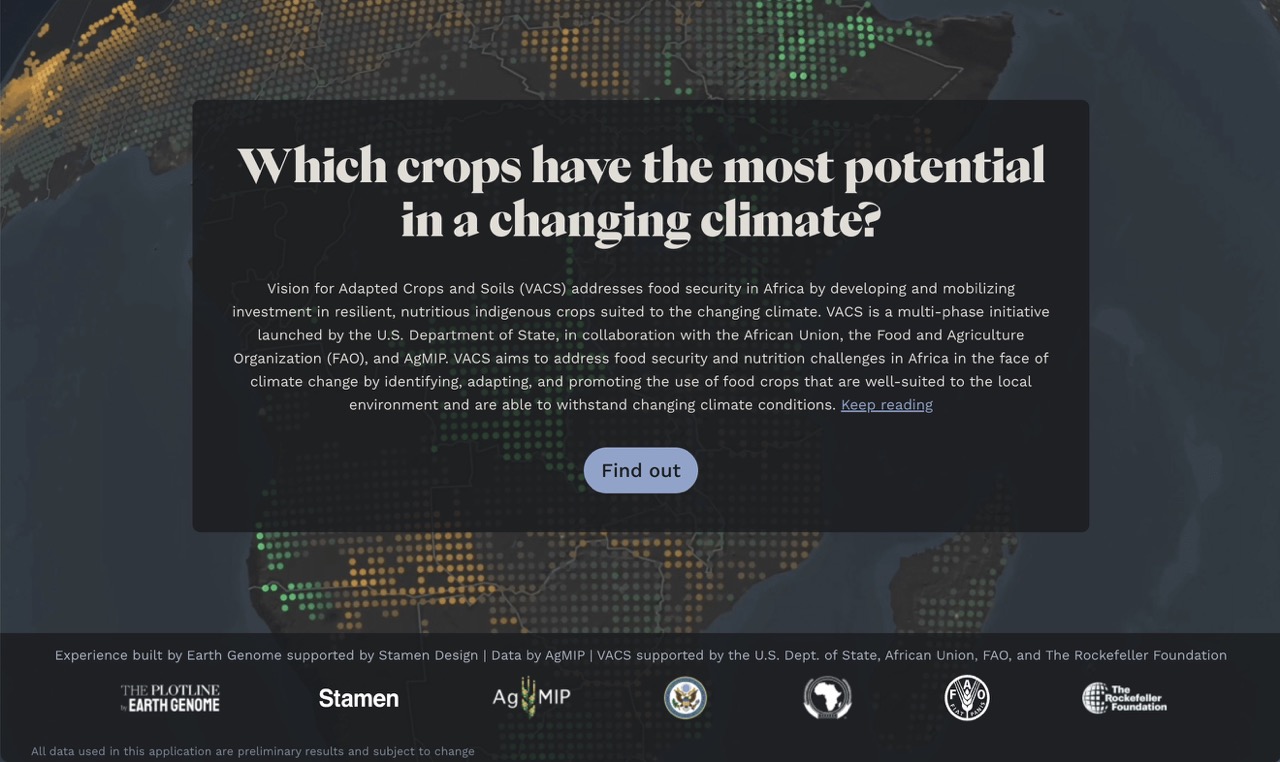
Vision for Adapted Crops and Soils Explorer
With the US State Department and AgMIP, we built this data exploration to address food security in Africa through investment in resilient, nutritious indigenous crops suited to the changing climate.

Food
Journalists
AI and data science
Data infrastructure
Policy makers
The Plotline
The Plotline is a collection of digital products focused on the intersection of Food and Climate. It brings together a community of data scientists, designers, and creative technologists on a mission to help create a food system rooted in data and designed to be resilient in the face of climate change.

Pollution
AI and data science
Product design
Visualization / data storytelling
Scientists
Revisiting Nuclear Test Fallout
Reconstruction and visualization of radionuclide deposition provides data at the highest available resolution for re-evaluation of public health and environmental impacts from atmospheric nuclear testing.

Journalists
Visualization / data storytelling
Pollution
The Margin
The Margin is an independent media platform that centers the people and places most affected by environmental injustice in the United States. Earth Genome helped found The Margin in partnership with journalists working to center the hidden stories of the environmental justice movement.